.png)
 AWS
AWS Microsoft Azure
 Google Cloud


How much eligible usage receives commitment pricing?
How much of the commitment you purchased is actually used?
How much savings do you retain after management fees?
You need all three.
This article explains our proposed benchmark methodology. It does not report customer cohort results, observed percentiles, or market-wide performance.
Check coverage and utilization together
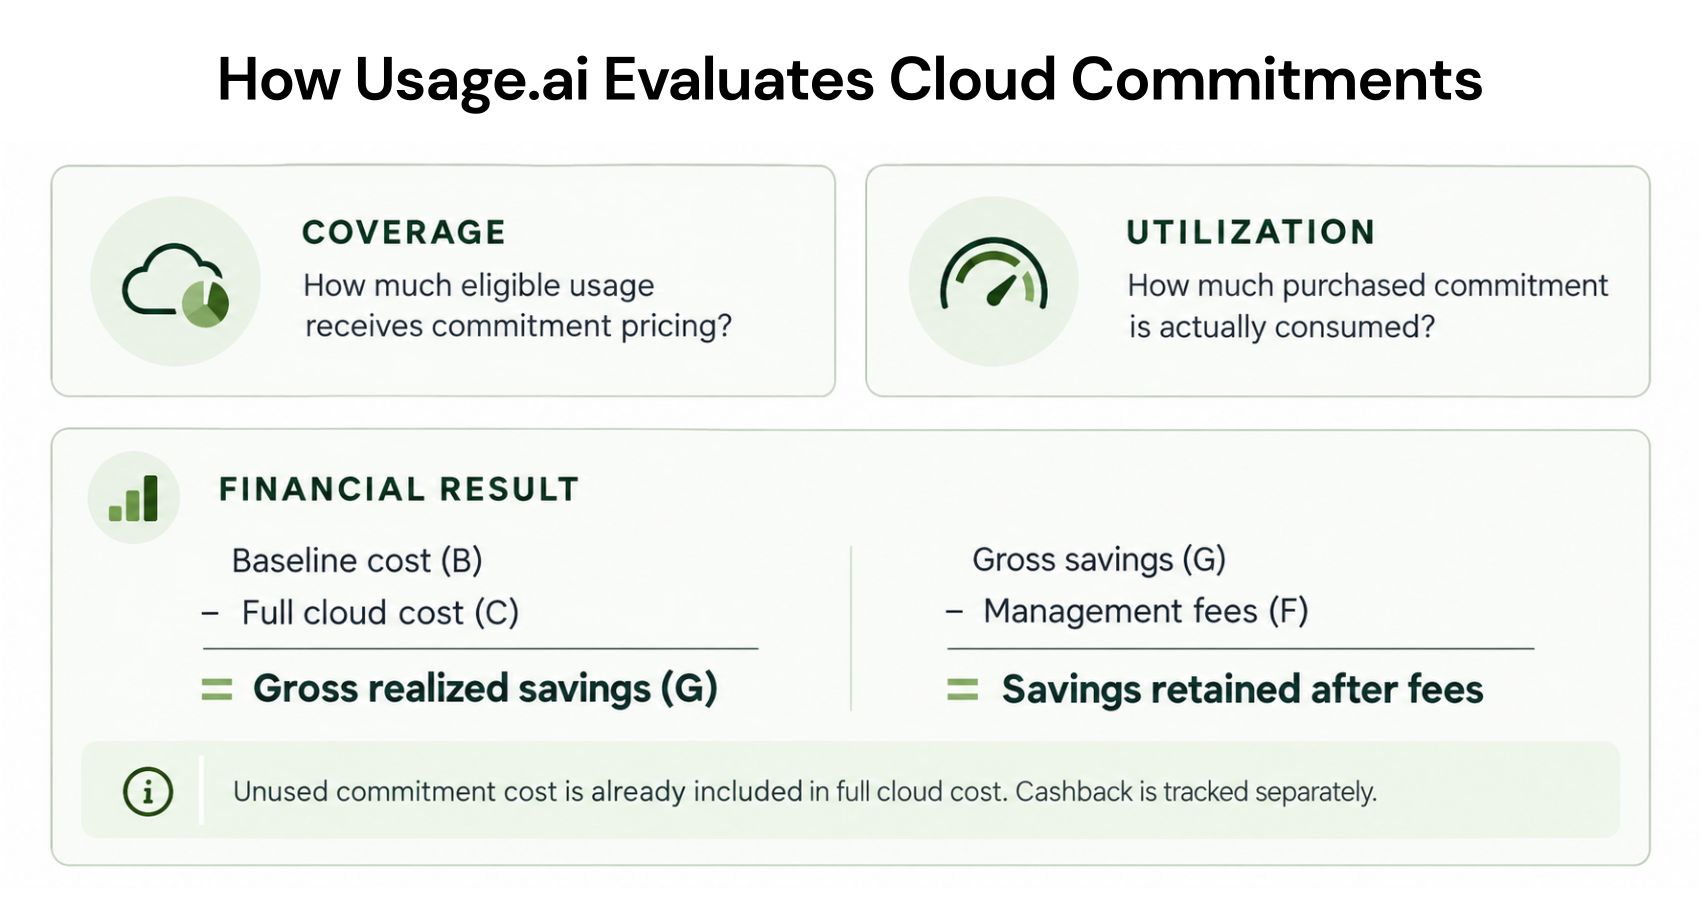
Coverage asks:How much eligible usage receives commitment pricing?
For our proposed comparison, first define which usage is eligible for the specific commitment program. Then value covered and uncovered usage on the same On-Demand-equivalent basis.
A practical coverage formula is:
Unused commitment records should not be counted as eligible consumption in the coverage denominator. Their cost still matters, but it belongs in the financial result.
AWS uses an On-Demand-equivalent approach in its Savings Plans coverage reporting.
The FinOps Open Cost and Usage Specification, or FOCUS, also provides an eligibility-adjusted commitment coverage methodology, but its example uses EffectiveCost weighting.
These are not interchangeable calculations. A benchmark needs to state which basis it uses.
Utilization asks a different question:
How much of the commitment you purchased is being consumed?
You should read coverage and utilization together.
| Coverage | Utilization | Next check |
|---|---|---|
| High | High | Check savings after fees and whether demand remains durable |
| Low | High | Inspect eligible uncovered usage before adding commitments |
| High | Low | Identify unused commitment cost and review workload timing, scope, and eligibility |
| Low | Low | Review uncovered usage and unused commitments separately |
No state alone is enough to justify another commitment purchase.
Keep utilization comparable across clouds
Commitment products do not all use the same units.That makes cross-cloud utilization harder to compare than simply placing AWS, Azure, and Google Cloud percentages in one table.
Google Cloud’s CUD analysis guidance explains that utilization cannot be calculated across aggregated CUD types when their underlying resource units are incompatible.
For our proposed benchmark, utilization should therefore be segmented by:
cloud provider,
commitment type,
compatible resource or spend unit,
and observation period.
A shared currency does not make unlike utilization measurements directly comparable.
Calculate savings against one defined baseline
Coverage and utilization show what is happening inside the commitment portfolio.They do not tell you how much money the portfolio actually saved.
For that, start with one defined baseline.
Let:
B = Baseline cost
This is the cost of the same eligible workload without the commitment discounts being measured.
The benchmark must state whether B uses public On-Demand rates or negotiated no-commitment rates. These answer different questions and should not be mixed.
Then define:
C = Full in-scope cloud cost
C should include the cost of the same usage and period, including:
uncovered eligible usage,
amortized commitment cost,
and unused portions of commitments.
Unused commitment cost should be included once. Do not deduct it again later.
Then:
And:
The FinOps Foundation Effective Savings Rate playbook uses an On-Demand-equivalent baseline.
FOCUS also provides an Effective Savings Rate methodology, but its example uses Contracted Cost and Effective Cost.
The important rule is consistency. Do not combine rates calculated from different baselines and present them as though they measure the same thing.
Show what remains after fees
Gross savings is not the final number a buyer should evaluate when management fees apply.For our proposed fee-only comparison:
F = management fees attributable to the same scope and period
Then:
If you include additional costs required to achieve the savings, identify those separately rather than hiding them inside F.
Cashback should also be tracked separately from this calculation.
For example, distinguish:
Cashback that has accrued,
Cashback that has been credited,
and Cashback that has been settled.
Build a cohort that supports a fair comparison
A benchmark becomes useful only when the underlying organizations and measurement periods are comparable.Our proposed methodology uses six controls.
1. Define the cohort before calculating results
State the cohort size, observation period, cloud providers, commitment programs, eligibility rules, exclusions, currency treatment, and data-rights requirements.Do not describe a small or selected customer dataset as representative of the broader market.
2. Compare like periods without assuming causation
If you compare pre-management and post-management periods, use the same metric definitions.Also record changes in:
workload demand,
workload mix,
provider pricing,
scope,
and commitment expirations.
3. Use one metric contract
Coverage, utilization, B, C, G, and F should have the same definitions across the relevant cohort.Do not change the cost basis between organizations or periods.
4. Track purchase origin and management status separately
For each commitment, record:when it was purchased,
who initiated the purchase,
and whether it was managed through our program during the measured period.
Portfolio savings should therefore remain separate from any estimate of incremental management impact.
5. Publish distributions, not only averages
For each comparable cohort, report:organization count,
25th percentile,
median,
and 75th percentile.
A median organization and a cost-weighted portfolio result answer different questions.
6. Disclose the limitations
Document:cohort selection,
missing observations,
incomplete periods,
exclusions,
data availability,
and any selection bias.
What should you compare before adding another commitment?
Before increasing commitment coverage, compare these three measures using the same scope and period:Coverage: How much eligible usage already receives commitment pricing?
Utilization: How much of the purchased commitment is consumed?
Savings after fees: How much financial value remains after the management fee?
The objective is not to maximize coverage or utilization in isolation. It is to understand whether the portfolio is producing retained savings while keeping commitment exposure aligned with actual demand.
How Usage.ai Evaluates Cloud Commitments
At Usage.ai, we focus on the recurring work of cloud commitment optimization and management across AWS, Azure, and GCP.Our platform analyzes usage and billing data to identify commitment opportunities. Teams can review recommendations through CoPilot or use Autopilot to manage eligible commitment decisions as usage changes.
For covered workloads, customers typically see 30–50% savings compared with on-demand pricing. We work alongside commitments you already own and manage, including AWS Savings Plans and Reserved Instances, Azure commitments, and GCP CUDs.
Eligible commitments managed through our Flex Insured Commitment Program can also include cashback protection if committed usage falls below expectations. That helps reduce the downside of overcommitting while still capturing commitment savings. See how Usage.ai calculates savings, fees, and cashback.
Before we enable purchasing, you can use the Usage.ai Savings Test with read-only access to see where additional commitment savings may exist in your current environment.
Review your commitment strategy
Before you add another commitment, compare coverage, utilization, and savings after fees using the same scope and period.Talk with our team about your existing commitments, eligible uncovered usage, and the questions to ask about savings after fees.
Frequently asked questions
Is high commitment utilization always a good result?
No. High utilization tells you that purchased commitment capacity is being consumed. It does not tell you whether substantial eligible usage remains uncovered or whether savings after fees are strong.
Can I compare AWS, Azure, and Google Cloud commitment utilization directly?
Not always. Commitment structures and resource units differ. Utilization should be segmented by compatible provider, product, and unit before financial outcomes are normalized separately.
Does this article publish a Usage.ai customer benchmark?
No. This article explains our proposed methodology for building a defensible benchmark. It does not publish customer cohort results, observed percentiles, market averages, or rankings.