.png)

Identifying idle and underutilized resources is still one of the highest-ROI levers in cloud cost optimization. Even mature FinOps organizations recognize that silent waste accumulates fastest in environments where resources scale quickly, ownership is fragmented, and migrations or experiments leave infrastructure behind. Yet despite years of guidance, most teams continue to miss large pockets of idle spend across their AWS footprint.
The challenge isn’t exactly awareness, but the complexity of its nature. Modern AWS environments span dozens or hundreds of accounts, multiple regions, and distributed engineering teams. As workloads evolve, resources drift from their original purpose, losing context about who owns them or whether they are still required. Idle instances, unused storage, stale load balancers, and abandoned network components become easy to overlook because they don’t break anything.
Traditional console-driven reviews don’t scale. A single utilization metric rarely tells the whole story, and AWS-native tools surface signals but not intent. The result is that organizations find idle resources only long after their budget leakage has compounded.
This guide breaks down the exact signals, metrics, and patterns engineers should use to identify idle and underutilized AWS resources with precision and how to operationalize this process so waste doesn’t return.
%2021%20(10).svg)
What is an Idle or Underutilized Resource?
In AWS, a resource is idle when it shows no meaningful compute, network, or storage activity over a defined period. This could mean a Lambda function with zero invocations, an EC2 instance with negligible CPU and network traffic, or an unattached EBS volume generating storage charges without serving any workload.
Underutilized resources are slightly different. Here, the workload exists, but the allocated capacity significantly exceeds actual consumption. Examples include EC2 instances running at 10% CPU for weeks, overprovisioned RDS instances with minimal connections, or GPUs deployed for sporadic batch jobs.
Underutilization usually stems from mismatches between workload patterns and resource profiles. It is usually a result of oversizing, conservative defaults, or inaccurate assumptions about peak demand. Idle resources, on the other hand, often result from operational anti-patterns like, forgotten experiments, incomplete decommissioning, or “zombie” infrastructure left behind after deployments or migrations.
Also read: AWS Savings Plans vs Reserved Instances: A Practical Guide to Buying Commitments
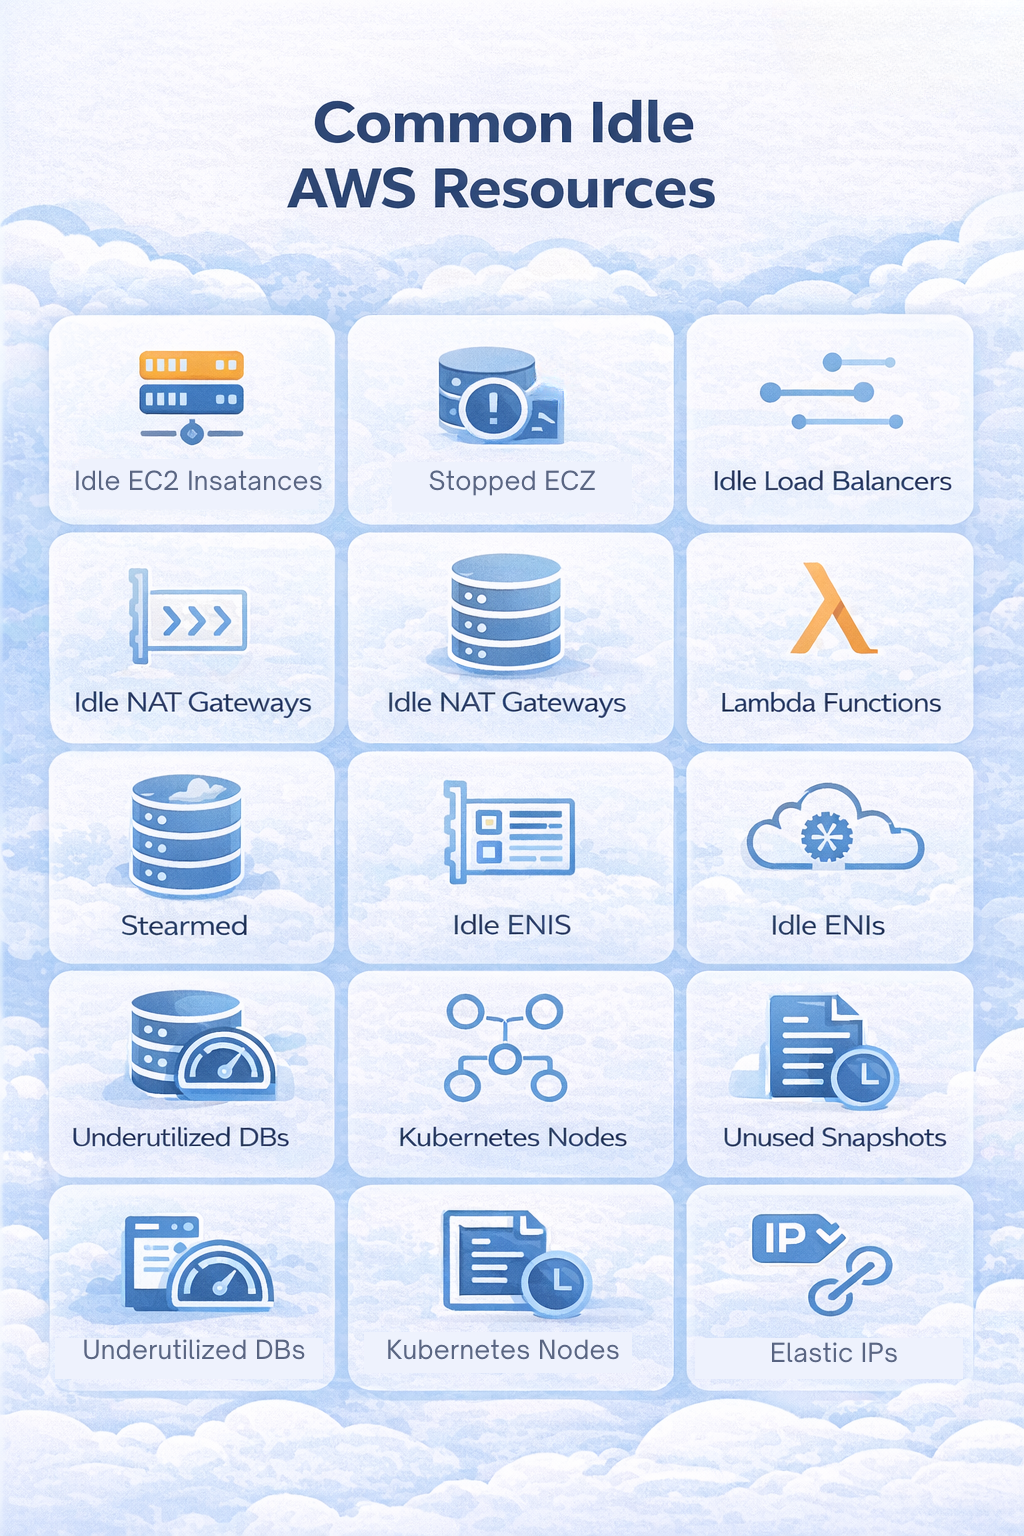
The Most Common Idle AWS Resources & Their Detection Signals
Idle resources manifest differently across AWS services, but they share a common pattern. Some of the most common detection signals include:
1. Idle EC2 Instances (Low CPU, Memory, Network)
Idle EC2 instances are one of the most common sources of AWS waste because they continue to generate compute, storage, and networking costs even when workloads have shifted or disappeared.
Technically, an EC2 instance is considered idle when CPU utilization remains under ~10–15%, network throughput is negligible, and disk operations approach zero over an extended window—typically 14–30 days.
To detect these patterns, engineers rely on:
- CloudWatch metrics (CPUUtilization, NetworkIn/Out, VolumeReadOps/WriteOps)
- AWS Compute Optimizer rightsizing insights
- AWS CLI queries (e.g., describe-instances with utilization tags)
Idle signals frequently surface in dev/test environments, lift-and-shift migrations, or orphaned nodes from Auto Scaling Groups that were never cleaned up.
2. Stopped EC2 With Billing Attachments
A stopped EC2 instance may appear harmless, but it often retains multiple chargeable components that continue billing silently in the background. Common cost contributors include:
- Attached EBS volumes, especially gp3 volumes provisioned with higher throughput or IOPS
- Elastic IPs detached from running instances,
- Orphaned snapshots
- Subscription-based Marketplace AMI fees that remain active independent of instance state. (Hourly-priced AMIs only bill while the instance is running.)
Detection requires more than checking instance state. Use the EC2 console or AWS CLI (describe-volumes, describe-addresses, describe-snapshots) to enumerate all dependent artifacts for instances stopped longer than 7 days. Many of these residual resources originate from incomplete decommissioning workflows or automation pipelines that terminate compute but leave storage and networking behind.
3. Idle Load Balancers (ALB/NLB/CLB)
Load balancers frequently persist long after the workloads they once routed traffic to have been decommissioned. Even without active traffic, ALBs, NLBs, and Classic LBs incur hourly charges and, in some configurations, additional LCU or data-processing costs. An idle load balancer typically shows zero ActiveConnectionCount, no healthy registered targets, and minimal or no request volume over a sustained period.
Detection requires checking both configuration and metrics. Use the EC2 Load Balancers console or CloudWatch metrics such as ActiveConnectionCount, RequestCount, and HealthyHostCount. The AWS CLI (describe-load-balancers, describe-target-health) can quickly identify LBs with no registered targets. These often accumulate in Kubernetes environments where service deletions do not automatically clean up associated AWS load balancers.
4. Lambda Functions With Zero Invocations
Lambda functions often accumulate as applications evolve, migrations occur, or event triggers are restructured. While Lambda is billed per request and execution time, inactive functions still generate indirect costs through CloudWatch log groups, retained log storage, and any provisioned concurrency configured for performance guarantees. A Lambda function is typically considered idle when it shows zero or near-zero Invocations over a 30–90 day period.
To identify these patterns, use CloudWatch metrics (Invocations, Errors, Throttles) or review historical activity in the Lambda console’s Monitor tab. The AWS CLI (list-functions, get-metric-statistics) can surface functions with no recent execution history. Always verify event sources, like API Gateway routes, S3 notifications, EventBridge rules to ensure the function is not intended for infrequent but critical workflows.
5. Idle NAT Gateways
NAT Gateways are one of the most common sources of silent AWS waste because they incur steady hourly charges plus data processing fees, regardless of whether any workloads are actively routing traffic through them. An idle NAT Gateway typically shows near-zero BytesProcessed, no meaningful ActiveConnectionCount, and little or no traffic across CloudWatch metrics over a defined period.
Detection requires reviewing CloudWatch metrics such as BytesProcessed and ActiveConnectionCount, then validating which route tables still point to the gateway. The AWS CLI (describe-nat-gateways) helps identify gateways with minimal recent traffic. Many idle NAT Gateways remain after networking changes, VPC refactoring, or application migrations where engineers update routes but forget to remove the original gateway.
6. Idle EBS Volumes & Snapshots
Unattached or underutilized EBS volumes are a persistent source of waste because storage is billed continuously until explicitly deleted. A volume becomes idle when:
- It remains unattached for more than seven days
- It shows no read/write operations
- It was provisioned with higher gp3 throughput or IOPS settings that exceed actual workload requirements
Snapshots can also accumulate silently, especially when automated backup processes retain long snapshot chains or fail to prune older generations.
Detection involves querying EBS state and utilization. Use the EC2 console or AWS CLI (describe-volumes, describe-snapshots) to surface unattached volumes, low-activity volumes, and snapshot sprawl. These artifacts frequently originate from incomplete teardown processes, ASG terminations, or developers manually detaching storage without cleaning up remaining dependencies.
Also read: Multi-Cloud Cost Optimization Guide for AWS, Azure, GCP Savings
7. Idle Elastic Network Interfaces (ENIs)
Elastic Network Interfaces often persist after instances or services are terminated, especially in dynamic environments where networking configurations change frequently. While most unattached ENIs do not incur significant direct cost, they create operational overhead, clutter VPCs, and can prevent subnet scaling or complicate security group management. An ENI is typically considered idle when it remains unattached and shows no inbound or outbound traffic across VPC Flow Logs for an extended period.
Detection starts by filtering ENIs in the EC2 console or using the AWS CLI (describe-network-interfaces) to list interfaces in the available state. For deeper validation, query VPC Flow Logs with CloudWatch Logs Insights or Athena to confirm that the interface has had no traffic. Many idle ENIs originate from ECS tasks, Lambda functions, or failed deployments that do not clean up network resources automatically.
8. Idle S3 Buckets & Storage Classes
S3 buckets rarely appear “idle” at a glance because they don’t attach to compute. However, any unused or cold data sitting in expensive storage classes can generate substantial long-term cost. A bucket is typically considered idle when:
- It shows little or no read activity over 30–90 days
- It retains objects that never transition to lower-cost tiers
- It accumulates logs, backups, or exports that are no longer referenced by any application
AWS S3 Storage Lens provides high-level insight into bucket activity, request trends, and storage distribution. For deeper analysis, S3 server access logs can be queried through Athena to identify objects or prefixes with no recent access. Once identified, apply Lifecycle Policies to transition infrequently accessed objects to S3 Standard-IA, Glacier, or Deep Archive, or delete obsolete buckets entirely. These patterns commonly emerge after data migrations, pipeline changes, or temporary analytics workloads.
9. Underutilized RDS, Aurora, ElastiCache, Redshift
Database and caching services frequently remain overprovisioned because teams size them for peak conditions that rarely occur. An instance becomes underutilized when:
- It consistently shows CPU usage below ~5–10%
- It has minimal active connections
- It has low read/write throughput across CloudWatch metrics
Replica drift is also common. Meaning, read replicas or cluster nodes may persist even after the workload that justified them has scaled down or changed architecture.
Detection involves reviewing RDS metrics (CPUUtilization, DatabaseConnections, ReadIOPS, WriteIOPS), Aurora performance insights, and ElastiCache or Redshift usage dashboards. The AWS CLI (describe-db-instances, describe-cache-clusters, describe-clusters) can help flag resources with sustained low activity. These inefficiencies typically arise from static provisioning, lift-and-shift migrations, or conservative sizing decisions made early in a project’s lifecycle.
10. Kubernetes Node Underutilization
Kubernetes clusters running on EC2 often carry significant hidden waste when node capacity exceeds actual pod demand. Underutilized nodes typically exhibit low CPU and memory consumption, low pod density, or workloads requesting far more resources than they consume. These patterns are common in EKS environments where teams set conservative CPU/memory requests, leaving the scheduler unable to pack pods efficiently.
Detection requires analyzing resource requests vs. actual usage through metrics from Prometheus, CloudWatch Container Insights, or the Kubernetes Metrics API. Look for nodes with consistently low utilization or clusters with uneven distribution of workloads.
How to Systematically Detect Idle Resources Across AWS at Scale
Detecting idle resources in a single AWS account is easy. But doing it reliably across a large, multi-account environment is considerably more complex. The challenge is not just finding low-utilization signals, but also validating them. Below is a systematic approach used by engineering and FinOps teams operating at scale.
1. Use Metrics, Logs and Events Together (Triangulated Detection)
A single CloudWatch metric rarely provides enough context to classify a resource as idle. To avoid false positives, rely on a triangulated signal model:
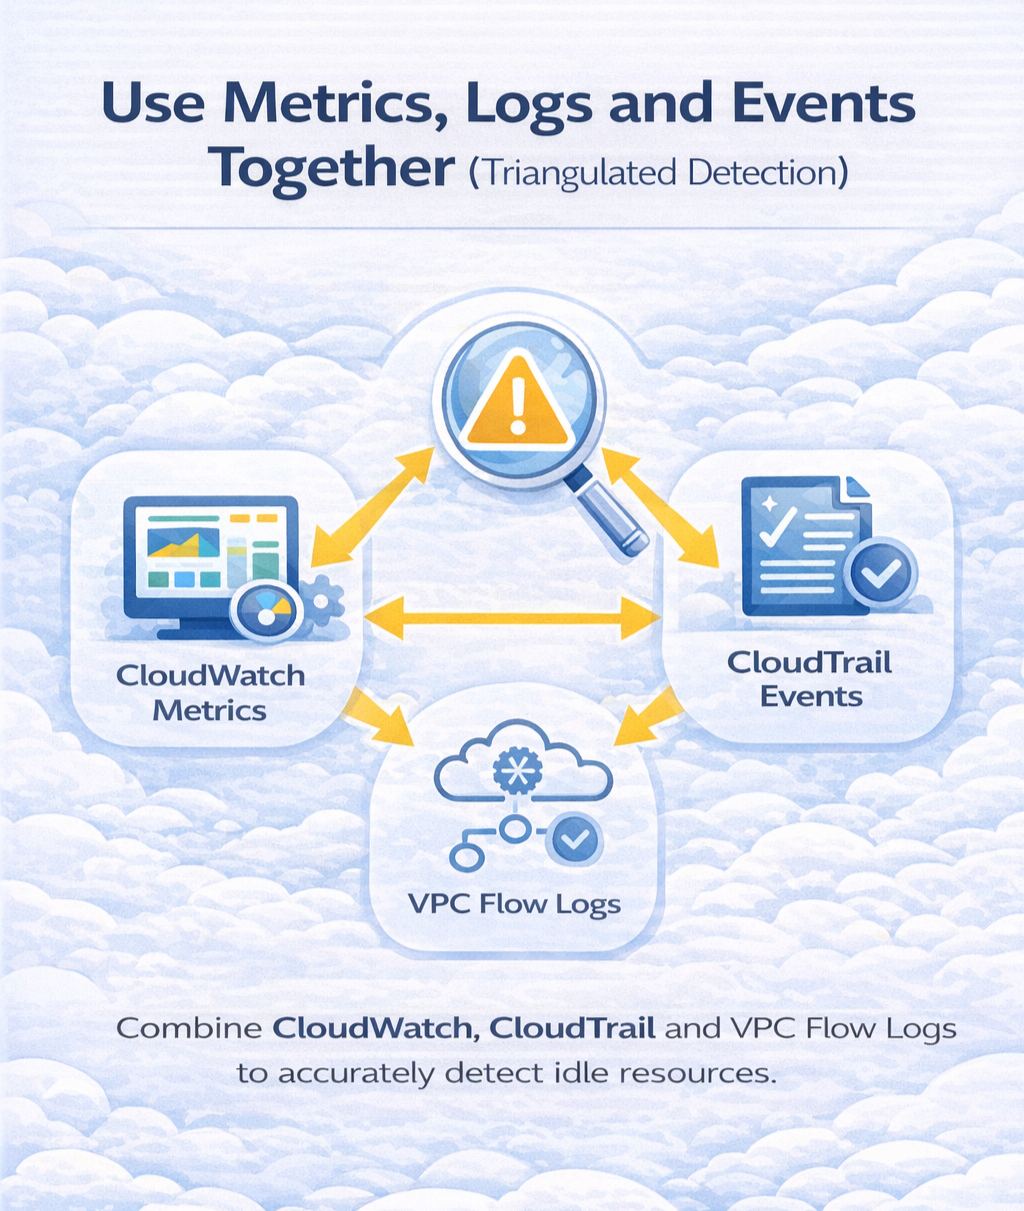
- CloudWatch Metrics: CPUUtilization, NetworkIn/Out, Read/Write Ops, Invocations, Connection counts.
- CloudTrail Events: API activity that reveals creation, modification, or operational intent.
- VPC Flow Logs: Confirms whether a resource is still participating in network paths.
This combination exposes whether a resource is truly inactive or simply under intermittent load. While metrics show consumption, events and logs reveal whether something is still part of an active workflow.
2. Multi-Account Strategy
Large organizations commonly operate tens or hundreds of AWS accounts under AWS Organizations. While this structure improves security and isolation, it complicates visibility. Idle resources are often overlooked because:
- Account-by-account reviews don’t scale.
- Permissions vary, limiting central FinOps oversight.
- Resource ownership is ambiguous without consistent tagging (owner, team, environment, lifecycle).
- Workloads shift across accounts, leaving artifacts behind.
Centralizing idle detection requires aggregated telemetry through AWS Organizations, AWS Cost Explorer, or custom ingestion pipelines that consolidate CloudWatch metrics and CloudTrail activity. Establishing mandatory tagging policies (e.g., via AWS Config or Service Control Policies) is also critical so resources can be tied back to teams for cleanup accountability.
Also read: How to Choose Between 1-Year and 3-Year AWS Commitments
3. CLI and Automation Scripts
Manual console reviews are not always enough for continuous detection. Automated scripts, typically using AWS CLI or boto3 can allow teams to scan entire regions or accounts in seconds. Some examples include:
- Querying all EC2 instances and filtering by low CPU over the last 14–30 days.
- Listing unattached EBS volumes or idle snapshots across all regions.
- Enumerating Lambda functions with zero invocations over a defined window.
- Checking NAT Gateways with minimal BytesProcessed.
These scripts can run on a schedule (e.g., via Lambda or Step Functions) and push findings into Slack, Jira, or a central FinOps dashboard. Furthermore, automation ensures consistency and removes the operational burden from engineering teams.
4. Policy-Based Continuous Detection
To keep idle resources from reappearing, organizations move from ad-hoc audits to continuous governance. AWS Config provides the foundation for this through rule-based evaluations. Some examples include:
- Flagging EC2 instances with no network activity for seven days.
- Detecting EBS volumes in the available (unattached) state.
- Ensuring S3 buckets have lifecycle policies.
- Validating that resources include required cost-allocation tags.
Config rules can auto-remediate (e.g., snapshot and delete an unattached volume) or trigger alerts for human review. Combined with guardrails in AWS Organizations, policy-based governance shifts idle detection from reactive cleanup to proactive prevention.
%2011%20(3).svg)
What Is Usage.ai and How It Automates Continuous Idle Resource Detection?
Usage.ai is an automated cloud cost optimization platform that helps engineering and FinOps teams reduce spend without changing infrastructure, rewriting workloads, or manually managing complex discount instruments.
Instead of relying on static Savings Plans or Reserved Instances, Usage.ai uses Flex Commitments, a dynamic purchasing engine that continuously adapts to your real usage patterns across AWS, Azure, and GCP. This allows teams to achieve meaningful and predictable savings even as workloads fluctuate.
While idle-resource detection focuses on uncovering wasteful infrastructure, Usage.ai focuses on the other half of the optimization equation, which is ensuring you never overpay for the resources you do use. Flex Commitments automatically analyze historical consumption, detect shifts in usage behavior, and apply the most cost-efficient commitment strategy available, all with minimal IAM permissions and zero engineering overhead.
In practice, this means that once your organization removes or rightsizes idle and underutilized resources, Usage.ai ensures your remaining workload is covered by the optimal blend of discounted rates, preventing cost drift and eliminating the operational burden of manually managing commitments. The platform also protects you from overcommitment by issuing rebates on unused commitment portions, something native cloud commitments cannot do.
This creates a continuous optimization loop:
- Your teams identify and remediate idle resources using internal processes or external tools.
- Usage.ai automatically adjusts commitments so your new usage baseline is always covered at the lowest possible effective rate.
- As workloads evolve, scale, or shift across regions or instance types, Usage.ai re-optimizes in real time, maintaining savings with no manual intervention.
See how much you can save on AWS with Usage AI. Sign Up now.
%2024%20(8).svg)
Frequently Asked Questions
1. What is an idle AWS resource?
An idle AWS resource is any compute, storage, or networking component that shows little to no activity (CPU, network, I/O, connections, or requests) over a sustained period. Examples include EC2 instances with consistently low utilization, unattached EBS volumes, load balancers without registered targets, or Lambda functions with zero invocations.
2. How do I find idle EC2 instances in AWS?
You can use CloudWatch metrics (CPUUtilization, NetworkIn/Out), Compute Optimizer recommendations, and AWS CLI queries to identify instances with CPU < 10–15% and minimal network throughput over 14–30 days. You should also check for stopped instances with attached EBS volumes or Elastic IPs that still incur charges.
3. Does AWS charge for stopped EC2 instances?
AWS does not charge for compute on stopped EC2 instances. However, attached EBS volumes, Elastic IPs not attached to running instances, snapshots, and some subscription-based Marketplace AMIs may continue billing until manually removed.
4. How do I detect unused load balancers in AWS?
Idle ALBs or NLBs typically show zero ActiveConnectionCount, no healthy targets, and minimal RequestCount. Use CloudWatch metrics and describe-load-balancers / describe-target-health in the AWS CLI to confirm whether the load balancer is actively used.
5. What is the best way to find idle NAT Gateways?
Review CloudWatch metrics such as BytesProcessed and ActiveConnectionCount. NAT Gateways with near-zero processing over multiple days are strong candidates for removal, after verifying no route tables still depend on them.
6. How can I check for unused Lambda functions?
Look at CloudWatch’s Invocations metric over a 30–90 day window. Lambda functions with no recent invocations or inactive triggers (API Gateway, S3, EventBridge) are typically safe to decommission.
7. How do I find unattached or idle EBS volumes?
List all volumes in the available state using the EC2 console or AWS CLI. Unattached volumes and snapshots often accumulate after instance terminations and should be reviewed for deletion.
8. How do I identify underutilized RDS, Aurora, or ElastiCache instances?
Check CloudWatch metrics like CPUUtilization, DatabaseConnections, FreeableMemory, and IOPS. Sustained low activity typically indicates overprovisioning or unused replicas.
9. Does AWS provide tools to detect idle resources automatically?
AWS offers partial visibility through Compute Optimizer, Trusted Advisor, Cost Explorer, and AWS Config. However, these tools do not detect all idle patterns, especially across multi-account environments or complex architectural deployments.
10. How does Usage AI help reduce cloud costs?
Usage AI automates discount optimization across AWS, Azure, and GCP using Flex Commitments, ensuring you always pay the lowest possible effective rate after removing or right-sizing idle resources. It adapts to changing workloads and eliminates the manual overhead of managing Savings Plans and Reserved Instances.