.png)


As more companies go multi-cloud, teams quickly discover that flexibility comes with a catch. Every cloud speaks a slightly different financial language. As you distribute workloads across AWS, Azure, and Google Cloud, they also inherit three different pricing models, spread across commitment systems, and billing conventions. The result is a fragmented view of spend that makes optimization far more challenging than in a single-cloud environment.
FinOps teams are feeling that pressure. The FinOps Foundation’s 2025 State of FinOps Report shows that workload optimization and waste reduction remain the number-one priority for more than half of practitioners, signaling that cloud waste is still widespread despite years of tooling and awareness. That’s where a disciplined multi-cloud cost optimization approach becomes essential.
This guide breaks down the foundation of how multi-cloud pricing works, why costs sprawl so quickly, and the best practices FinOps teams rely on to control spend across AWS, Azure, and GCP. By the end, you’ll have a structured playbook for reducing waste, and building multi-cloud cost optimization that scales.
Challenges of Multi-Cloud Cost Optimization
Introducing multiple cloud providers naturally adds a new layer of complexity to your organization. Each cloud option (AWS, Azure, and Google Cloud) comes with its own pricing engine, commitment models, billing structures, and discount mechanisms. Put them together, and you’re suddenly juggling three completely different ways of understanding cost. When these differences collide, even mature FinOps teams struggle to maintain clarity and control. Here’s why.
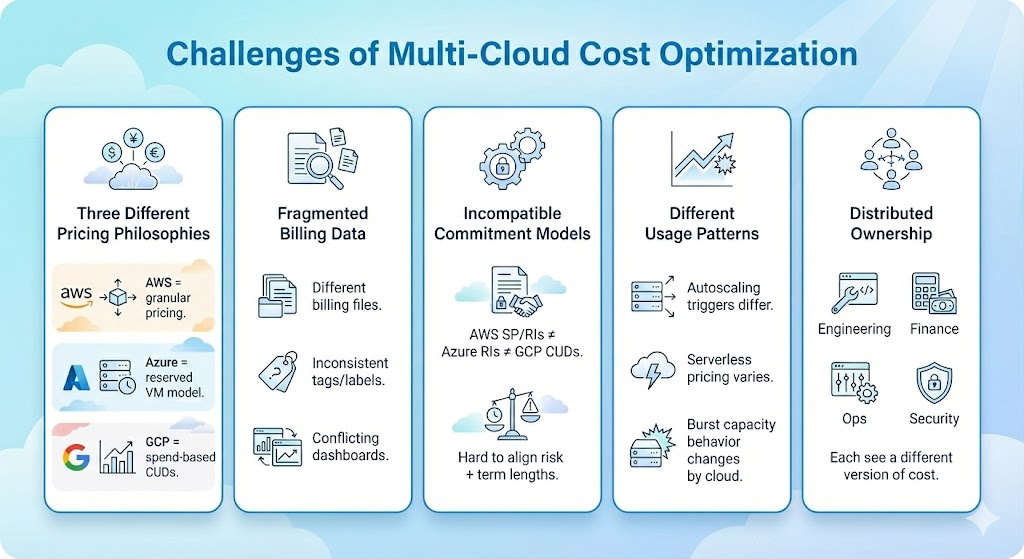
1. Three Clouds Means Three Different Pricing Philosophies
AWS bills primarily through granular metering and long-term commitment discounts like Savings Plans and Reserved Instances. Azure relies heavily on Reserved VM Instances with exchange rules but more rigid configurations. GCP uses Committed Use Discounts (CUDs) with a unique spend-based model.
Even when two workloads look identical, the cost dynamics behind them rarely are. This makes cross-cloud comparison and forecasting far more difficult.
2. Fragmented Billing Data Creates Blind Spots
Most organizations receive separate billing files, multiple sets of cost allocation tags or labels, and different dashboards. This leads to a few common issues:
- Inconsistent cost visibility: Each cloud reports usage differently.
- Conflicting allocation rules: Tags and labels don’t align across providers.
- Fragmented ownership: Finance, engineering, and operations all see different versions of spend.
- Slower decision-making: Teams spend more time reconciling data than optimizing it.
These gaps make it hard to answer foundational questions like “What are we actually spending per team?” or “Which workload is driving cost spikes?”
3. Commitment Models Don’t Translate Across Clouds
A commitment strategy that works well in AWS may fail in GCP. Without a unified view of workload stability, teams may either under-commit to avoid risk or over-commit and absorb unnecessary costs.
Learn More: How to Choose Between 1-Year and 3-Year AWS Commitments
4. Usage Patterns Behave Differently in Different Cloud
Each cloud has its own behavior when it comes to workload patterns. Autoscaling rules may trigger differently, serverless pricing may vary by provider, and platforms handle burst capacity or ephemeral workloads in their own way. Because these patterns rarely line up from one cloud to another, your usage trends can look inconsistent. And unless you normalize those signals, your forecasts end up guessing instead of predicting.
5. Ownership Is Distributed Across Many Teams
In most multi-cloud organizations, cost ownership is spread across several teams. For example, engineering deploys resources, finance tracks budgets and spending trends, operations manages reliability, and security governs access and compliance. FinOps sits in the middle trying to create a unified cost strategy. The result is fragmented decision-making and no single, consistent optimization strategy that works across all providers.
Multi-Cloud Cost Commitments 101 Across AWS, Azure, and GCP
Commitments are the single most powerful savings mechanism in the cloud, often delivering 20–70% off compute and database costs. But they are also the easiest place to make expensive mistakes, especially in a multi-cloud environment where each provider’s commitment model behaves differently.
Understanding how these commitments work and how they differ is essential before building a multi-cloud cost optimization plan.
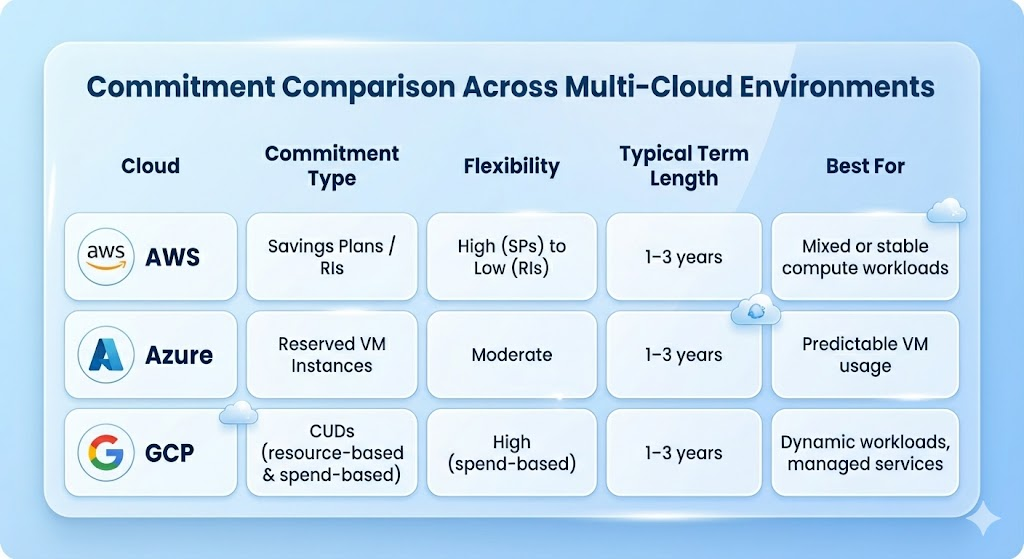
AWS: Savings Plans and Reserved Instances
AWS offers the broadest range of commitment options, and they form the foundation of most AWS optimization strategies.
- Savings Plans (SPs) are the most flexible: You commit to a consistent amount of compute spend per hour for 1 or 3 years, and AWS automatically applies the discount across EC2, Fargate, and Lambda (depending on plan type). Savings Plans shift discounts dynamically to whichever resources are running, making them ideal for evolving or mixed workloads.
- Reserved Instances (RIs) are more specific: They provide significant discounts but require committing to exact instance attributes (e.g., region, family, tenancy). RIs are best suited for stable, predictable workloads where configurations rarely change.
Azure: Reserved VM Instances (RIs)
Azure’s commitment model is more rigid but straightforward. Reserved VM Instances allow you to reserve specific VM instances for 1 or 3 years to receive discounts.
Azure RIs can be exchanged in some circumstances if workload needs shift, but they still lack the broad flexibility of AWS Savings Plans. Azure also uses an enterprise-style subscription model, which impacts how budgets and cost allocation are structured.
Google Cloud: Committed Use Discounts (CUDs)
Google Cloud takes a different approach with Committed Use Discounts, offering two models. Resource-based CUDs commit to specific vCPU and RAM amounts, while spend-based CUDs commit to a monthly spend for services like BigQuery or Cloud SQL.
Spend-based CUDs are the most flexible of the three clouds because they allow Google to apply discounts automatically across qualifying services. However, workload variability can still introduce risk if usage dips below the committed amount.
Why Multi-Cloud Teams Overspend: The #1 Reason is Under-Commitment
Across every industry, multi-cloud organizations share the same pattern, which is they commit far less than they should. Not because they don’t understand commitments and the 20–70% discounts that come with it. The real issue is risk perception. Teams are afraid of making the wrong commitment and absorbing the cost of underutilization, so they default to on-demand pricing far more than necessary.
In a single cloud, this caution is already expensive. In a multi-cloud environment, it becomes a multiplier across three clouds, three commitment models, and three forecasting uncertainties. Without a unified view of workload stability across platforms, teams consistently underestimate how much they can safely commit.
Another driver of under-commitment is data latency. Native cloud tools often refresh recommendations every few days, sometimes longer. By the time teams receive updated signals on usage patterns, the opportunity to purchase an optimal commitment may have already passed.
Multi-cloud organizations feel this even more acutely because each cloud surfaces recommendations on its own cadence, and with its own logic, leaving FinOps teams to reconcile fragmented insights.
Multi-Cloud Cost Optimization Best Practices
Optimizing costs across multiple cloud providers requires a framework that brings consistency to environments that were never designed to work together. The teams that succeed are the ones who apply a unified set of practices that normalize cloud behavior, and make costs predictable across AWS, Azure, and GCP.
Below are the core practices that define mature multi-cloud FinOps operations.
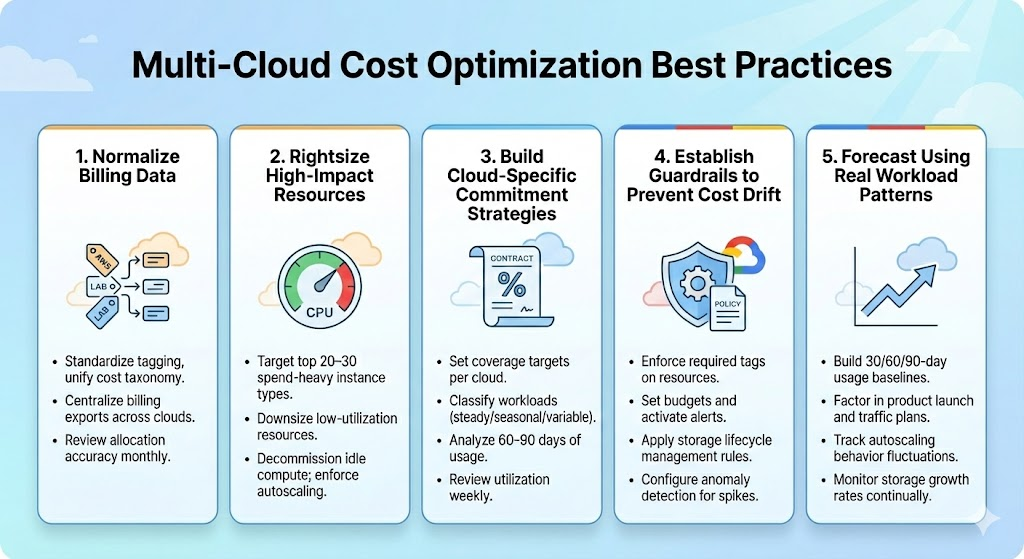
1. Normalize Billing Data So Every Cloud Speaks the Same Language
If each cloud reports cost differently, you cannot forecast, commit, or optimize consistently. Normalization turns three incompatible billing systems into a single source of truth you can actually act on. Here’s what you can do:
- Define a global tagging and labeling standard (e.g., team, service, env, owner) and enforce it through AWS IAM, Azure Policy, and GCP Organization Policy.
- Create a unified cost taxonomy so EC2, Azure VMs, and GCE VMs all roll up into the same “compute” category.
- Centralize billing exports from all three clouds into one normalized dataset (BigQuery, Snowflake, Redshift, or a FinOps platform).
- Run monthly cost allocation accuracy reviews with engineering leads to validate ownership, tags, and unallocated spend.
2. Rightsize the Resources That Drive the Majority of Spend
Most multi-cloud waste comes from oversized or idle compute, databases, and storage. Rightsizing works only when it focuses on the resources that materially impact cost, and not on scattered cleanup tasks that don’t move the needle. Here’s what you can do:
- Identify the top 20–30 instance types or VM sizes across AWS, Azure, and GCP that represent 70–80% of total compute spend.
- Apply simple utilization thresholds:
- If below 30–40% avg CPU/RAM, downsize
- If 0% CPU or network for 7+ days, decommission
- Review managed database usage (RDS, Azure SQL, Cloud SQL) and match instance sizes to real IOPS and CPU patterns.
- Enforce autoscaling where appropriate; static fleets are almost always overprovisioned.
3. Build a Commitment Strategy Tailored to Each Cloud
Commitments are the biggest source of savings, but each cloud has different rules, flexibilities, and risks. A one-size-fits-all commitment strategy will fail in multi-cloud. Here’s what you can do:
- Set coverage targets per cloud based on actual workload stability (e.g., 70–90% for predictable AWS compute, lower for Azure workloads with variability).
- Classify workloads as steady, seasonal, or variable, and commit only the steady ones.
- Analyze 60–90 days of usage patterns before purchasing Azure Reserved Instances or Google CUDs.
- Review commitment utilization weekly, not quarterly; course correction needs to be fast.
4. Establish Guardrails That Prevent Cost Drift
In multi-cloud environments, spend drifts quickly when new resources are created without standards or lifecycle policies. Guardrails ensure that cost hygiene stays consistent even as teams scale. Here’s what you can do:
- Enforce required tags and labels through AWS IAM, Azure Policy, and GCP Organization Policy before workloads can be deployed.
- Set budgets and automated alerts on each cloud account/subscription/project to catch early spikes.
- Apply storage lifecycle rules (e.g., move unused S3 objects to IA after 30 days, Glacier after 90 days; mirror rules in Azure Blob and GCS).
- Configure anomaly detection to alert on 20% day-over-day or 50% week-over-week increases.
5. Forecast Using Real Workload Patterns, Not Guesswork
Accurate commitment and rightsizing decisions depend on understanding workload behavior. Multi-cloud environments amplify variability, so forecasting must be grounded in actual usage signals. Here’s what you can do:
- Build rolling 30/60/90-day baselines for core compute and database workloads to identify stability.
- Incorporate business signals like feature launches, traffic events, and onboarding cycles into spend projections.
- Track autoscaling patterns across EKS, AKS, and GKE to understand burst capacity needs.
- Measure storage growth rates (month-over-month %) to anticipate future lifecycle transitions or capacity needs.
Where Usage.ai Fits in a Multi-Cloud Cost Strategy
Each cloud has its own rules, discount mechanics, lock-in periods, and risk profile. And no team, no matter how experienced, can manually forecast three clouds’ workload patterns with the accuracy needed to commit confidently every time.
That’s where Usage AI fits.
Usage AI is a cloud cost optimization platform that handles the part of optimization teams struggle with manually:
- interpreting complex usage signals,
- identifying safe commitment opportunities,
- purchasing commitments at the right moment, and
- protecting teams when usage drops unexpectedly.
Instead of penalizing teams for getting commitments “wrong,” Usage.ai absorbs the downside risk by offering real cashbacks (not credits) when usage dips. This makes commitments feel less like a gamble and more like a strategy.
Here’s what the platform actually does:
Daily usage analysis across AWS, Azure, and GCP
Instead of relying on 7-day-old native recommendations, Usage.ai refreshes data every 24 hours, constantly recalculating the safest commitment opportunities.
Automated commitment recommendations and purchases
Teams approve the buy, and Usage.ai handles the procurement of Savings Plans, Reserved Instances, or equivalent Flex Commitments ensuring organizations capture discounts at the exact moment usage supports it.
Flex Commitments: SP/RI-like discounts without long lock-in
For workloads that are stable but not perfectly predictable, Usage.ai provides Flex Commitments, which are discounts similar to AWS SPs or RIs without requiring customers to take on long-term risk.
Cashback protection when usage drops
If a commitment is underutilized, Usage.ai pays real cashback to cover the gap. This lets teams commit more aggressively without worrying about over-buying.
Fee model tied to realized savings
Usage AI only charges a percentage of the savings it actually delivers meaning organizations pay nothing unless they save. This fundamentally removes the operational burden and financial risk of managing commitments across multi-cloud systems.
Conclusion
Multi-cloud environments give organizations flexibility, resilience, and access to best-of-breed services, but they also introduce cost complexity that can’t be solved with one-off cleanups or isolated optimization tasks.
The teams that succeed are the ones that normalize their cost data, and commit with confidence. When they reach the point where manual commitment decisions become the bottleneck, platforms like Usage.ai help stabilize the process by automating analysis, securing discounts, and reducing risk through cashback protection. That combination of discipline and automation is ultimately what turns multi-cloud cost optimization from an ongoing struggle into a sustainable practice.
Frequently Asked Questions
1. What is multi-cloud cost optimization?
Multi-cloud cost optimization is the process of managing and reducing spend across AWS, Azure, and GCP. The goal is to create consistent cost visibility and predictable savings across all cloud environments.
2. Why do companies overspend in multi-cloud environments?
Overspend happens because each cloud uses different pricing, billing formats, and commitment structures. This inconsistency makes forecasting harder, leading teams to under-commit and default to expensive on-demand rates.
3. How do commitment programs differ between AWS, Azure, and GCP?
AWS offers Savings Plans and Reserved Instances, Azure uses Reserved VM Instances, and GCP uses Committed Use Discounts. They vary in flexibility, term length, and risk.
4. What are the most effective ways to reduce multi-cloud cloud costs?
Start by normalizing cost data across providers, enforcing consistent tagging, and rightsizing top spend drivers. Then set commitment coverage targets for each cloud and implement guardrails like budgets, lifecycle policies, and anomaly detection to prevent cost drift.
5. How does Usage.ai help with multi-cloud cost optimization?
Usage.ai analyzes AWS, Azure, and GCP usage daily, recommends and automates commitment purchases, and provides cashback when commitments are underutilized. This reduces financial risk and helps teams achieve higher, safer commitment coverage across clouds.