.png)


What Is Cloud Cost Visibility?
Cloud cost visibility is the ability to see exactly where your cloud money is going, broken down by service, team, environment, workload, and business unit – in near real time. It answers questions a monthly invoice cannot:
Which team’s workload drove that $40,000 spike last Tuesday? Is that dev environment still running from three months ago? Why did RDS costs jump 22% when traffic was flat?
Most organizations have some visibility – a billing dashboard, a Cost Explorer export, maybe a chart someone built two years ago. What they lack is actionable visibility: data granular enough to attribute, fresh enough to act on, and structured for both engineering and finance to use simultaneously.
Good cloud cost visibility has three measurable properties:
- Attribution: Every dollar of spend maps to a team, project, environment, or application – not just a service or account.
- Freshness: Cost data and anomaly alerts reflect usage within 24 hours, not 48-72 hours after the fact.
- Actionability: The output drives a decision – a commitment purchase, a rightsizing action, a budget conversation – not just a report.
Without all three, you have a dashboard, not visibility.
Why Cloud Cost Visibility Fails at Scale
The Four Structural Causes
Visibility breaks down for predictable reasons. Fixing any one of them improves the picture. Fixing all four closes the gap.
- Tagging is inconsistent or absent. Resource tagging is the backbone of cost attribution. A tag like team=backend or env=production lets you slice a $2M AWS bill into owner-level segments. Without it, shared infrastructure costs pile up as a lump sum that tells finance nothing and gives engineering no accountability lever. According to internal Usage.ai research, this is the most common structural cause of attribution failure across enterprise cloud accounts.
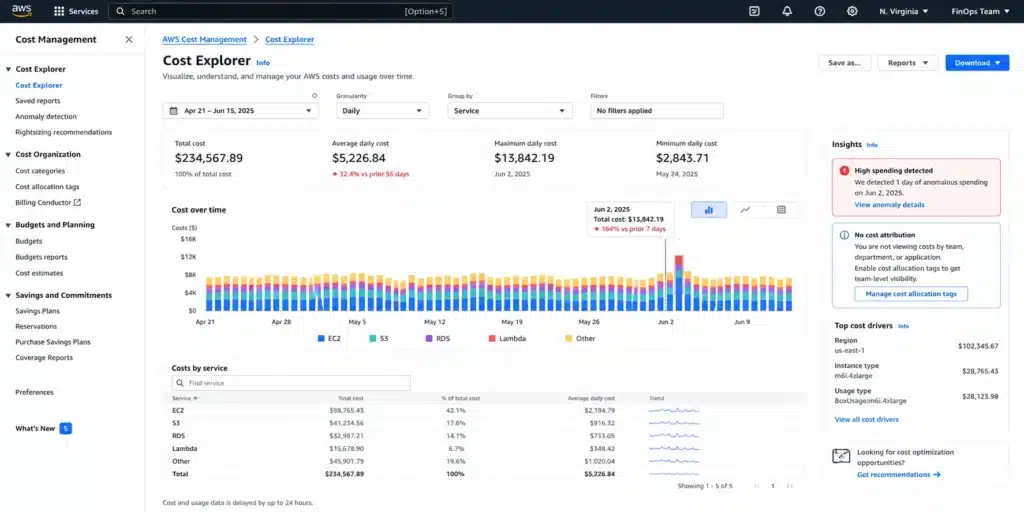
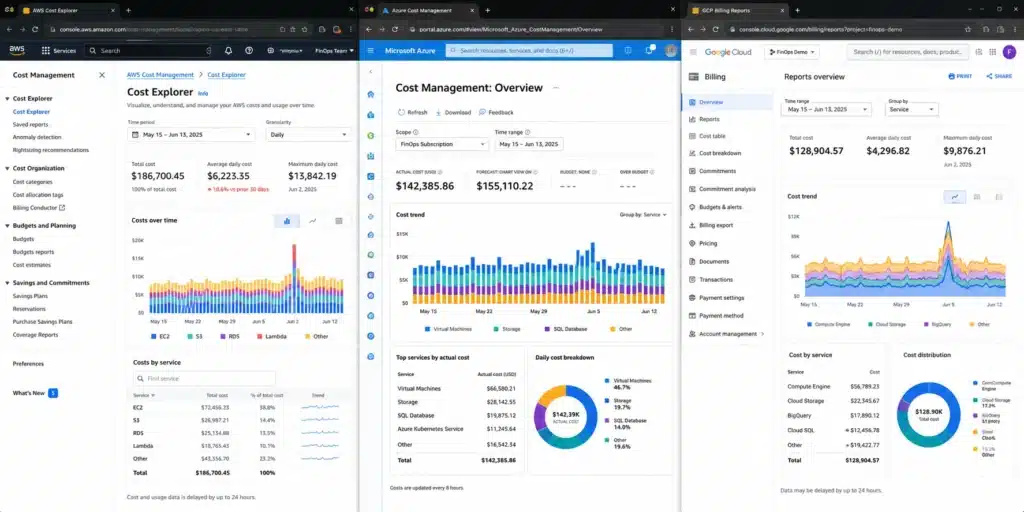
- Multi-cloud environments fragment the data. AWS Cost Explorer shows only AWS. Azure Cost Management shows only Azure. GCP Billing shows only GCP. If your stack spans two or three providers – which is standard above Series B – you are reconciling data across three separate interfaces, three billing cycles, and three cost allocation models. The consolidated view does not exist natively.
- Billing data has a freshness lag. AWS billing data refreshes at least once every 24 hours, but some cost categories and recommendation types update less frequently. Azure and GCP have similar constraints. For anomaly detection, catching a runaway job before it runs for three days requires data that is closer to real-time than most native dashboards provide.
- Dashboards show cost, not cause. A spike in Cost Explorer tells you spend went up. It does not tell you which auto-scaling group triggered it, which engineer deployed it, or whether it was intentional. Visibility without root cause attribution is not actionable.
Native Cloud Cost Tools: What Each Provider Gives You
Every major cloud provider includes a native cost management tool at no additional charge. For single-cloud teams under $500K/month, native tools are often sufficient if configured correctly. Here is where each one stands.
| Provider | Tool | Covers Well | Key Gaps |
| AWS | Cost Explorer + Budgets + Cost Anomaly Detection | Linked account consolidation, SP/RI utilization, forecasting, budget alerts | No multi-cloud, no Kubernetes workload attribution, EKS costs show as EC2 |
| Azure | Cost Management + Billing | Tag enforcement via Azure Policy, subscription/resource group breakdown, CSP multi-tenant support | No multi-cloud consolidation (AWS connector costs extra), no AKS workload attribution |
| GCP | Cloud Billing Reports + BigQuery export | Project/SKU/label breakdown, powerful SQL analysis via BigQuery export, Pub/Sub budget alerts | No multi-cloud, no GKE namespace-level attribution without additional tooling |
The shared gap across all three: None of them give you a unified multi-cloud view. None attribute Kubernetes costs at the workload level natively. And none connect cost data to the action layer – purchasing or adjusting commitments, flagging idle resources for termination, or routing anomalies to the right team automatically.
For teams running two or more clouds, or spending above $500K/month on a single cloud, native tools become the data source – not the analysis layer. Also read: Finout vs Usage.ai: Cloud Cost Visibility vs Cloud Cost Execution.
Cloud Cost Visibility Tools: Full Comparison
The table below covers native and third-party platforms across the dimensions that matter for an actual evaluation. Pricing should be verified directly with each vendor.
| Tool | Multi-Cloud | Kubernetes Cost Allocation | Data Freshness | Commitment Optimization | Anomaly Detection | Best For |
| AWS Cost Explorer | AWS only | No | 24 hrs (some categories longer) | Utilization reports only | Via separate service | AWS-only teams |
| Azure Cost Management | Azure (AWS connector extra) | No | Daily | Utilization reports only | Budgets + alerts | Azure-heavy teams |
| GCP Cloud Billing | GCP only | No | Daily | CUD tracking | Budget alerts | GCP teams with BigQuery capability |
| Vantage | AWS, Azure, GCP + 20 integrations | Yes | Near real-time | Coverage reports | Yes | Multi-cloud teams needing breadth |
| nOps | AWS primary, GCP/Azure added | Yes (EKS) | Daily | Automated SP/RI purchasing | Yes | AWS-first companies |
| Harness CCM | AWS, Azure, GCP, Kubernetes | Yes | Near real-time | Recommendations | Yes | Engineering-led orgs with Kubernetes at scale |
| Flexera One | AWS, Azure, GCP + on-prem | No | Daily | RI recommendations | Yes | Enterprise with hybrid cloud |
| Apptio Cloudability | AWS, Azure, GCP | Limited | Daily | RI recommendations | Yes | Finance-led FinOps programs |
| Usage.ai | AWS, Azure, GCP | Via commitment layer | 24 hrs | Fully automated with cashback guarantee | Via commitment deviation | Teams prioritizing commitment automation + zero lock-in savings |
All data refresh rates sourced from official vendor documentation as of June 2026 – verify at each vendor’s documentation before purchasing.
The One Thing That Determines Whether Visibility Is Useful: Tagging
No visibility tool compensates for poor tagging. A dashboard full of unattributed EC2 spend is noise, not visibility.
The minimum tag set that makes cost attribution functional:
| Tag Key | Example Value | Purpose |
| team | backend, data-platform | Team-level cost allocation |
| environment | production, staging, dev | Environment cost split |
| project | checkout, ml-pipeline | Application/product attribution |
| cost-center | CC-1042 | Finance chargeback mapping |
| owner | [email protected] | Accountability and anomaly routing |
Enforcement by provider:
- AWS: Activate Cost Allocation Tags in the Billing console first – tags do not appear in Cost Explorer until activated. Use AWS Config rules to audit untagged resources. SCPs can enforce tagging at the account level for some resource types.
- Azure: Azure Policy can block resource creation if required tags are missing – the strongest native enforcement of the three providers.
- GCP: Labels are the GCP equivalent of tags. Org Policies can restrict resource creation based on label presence for some services. For enforcement, most teams use Terraform or deployment automation to require labels at provisioning.
The practical rule: enforce tagging at the infrastructure-as-code layer, not after the fact. Retroactive tagging campaigns on thousands of existing resources take weeks and are never fully complete.
Choosing the Right Tool: A Decision Framework
Choose native tools when:
- You operate on a single cloud provider
- You are under $500K/month in cloud spend
- Tagging is consistent and your team has FinOps bandwidth to interpret exports manually
- Your primary need is spend trending and budget alerting
Choose Vantage when:
- Multi-cloud consolidation with broad integration support is the primary requirement
- You need near real-time anomaly detection across AWS, Azure, GCP, Snowflake, and SaaS tools
- Your team is technically oriented and values API-first access to cost data
Choose Harness CCM when:
- Kubernetes workload-level cost attribution is a primary requirement across EKS, AKS, and GKE
- You need cost attribution at the namespace, deployment, or pod level
Choose nOps when:
- AWS is your primary cloud and you want automated commitment management alongside visibility in one platform
- EKS cost allocation matters alongside commitment optimization
Choose Usage.ai when:
- Your primary goal is maximizing savings on commitments (Savings Plans, Reserved Instances) across AWS, Azure, and GCP
- You want fully automated commitment purchasing with zero lock-in and a buyback guarantee on underutilization – underutilized commitments return cashback in real money, not credits
- You need 30-minute setup via billing-layer access only, with no infrastructure changes
- You are spending $200K+/month and manual commitment management is consuming FinOps or engineering time
Choose Flexera or Apptio Cloudability when:
- You manage hybrid cloud (cloud plus on-premises) and need unified cost governance
- Total technology spend management (ITAM + cloud) in a single platform is a requirement
Usage.ai Insured Flex Commitments carry no multi-year lock-in. Commitments adjust quarterly. Scale down? No penalty. Underutilized? Cashback paid in real money – not credits.
Setup takes 30 minutes via billing-layer access. The fee is a percentage of realized savings only – zero fee if nothing is saved. The platform has delivered over $91M in savings to 300+ enterprise customers including Motive, EVGo (NASDAQ: EVGO), Blank Street Coffee, and Secureframe.
Frequently Asked Questions
1. What is cloud cost visibility?
Cloud cost visibility is the ability to track, attribute, and analyze cloud spending at a granular level – broken down by service, team, environment, and business unit – in near real time. It goes beyond a monthly invoice to answer: which team is responsible for which spend, where waste is occurring, and whether current trajectory will exceed budget before the billing cycle closes.
2. What is the difference between cloud cost visibility and cloud cost optimization?
Visibility is knowing where your money is going. Optimization is acting on that information to reduce waste. They are sequential – you cannot optimize effectively without accurate visibility, but visibility alone does not save money. Optimization involves actions like rightsizing compute, eliminating idle resources, and purchasing commitments (Savings Plans, Reserved Instances, Committed Use Discounts) to reduce on-demand rates by 30-60%.
3. How do I get cloud cost visibility across AWS, Azure, and GCP in one place?
Native tools do not consolidate multi-cloud billing without significant engineering effort. Third-party platforms – Vantage, Harness CCM, CloudHealth, Apptio Cloudability – ingest billing data from all three providers into a unified dashboard. Alternatively, exporting billing data to BigQuery (GCP), Athena via CUR (AWS), and Azure Data Explorer and building a Looker Studio or Grafana layer is viable for teams with the engineering bandwidth to maintain it.
4. Why do my cloud cost dashboards show data that is 1-3 days old?
Cloud providers update billing data on a 24-72 hour lag depending on service type and usage metering methodology. AWS billing data refreshes at least once per day, but some cost categories and recommendation types update less frequently. This means cost anomalies can compound for 1-3 days before appearing in standard dashboards – which is why cost anomaly alerting, not just dashboard monitoring, is essential at any meaningful spend level.
5. What is the most important first step to improve cloud cost visibility?
Activate and enforce resource tagging. No visibility tool can attribute costs to teams, projects, or environments without tagged resources. On AWS, activate Cost Allocation Tags in the Billing console – tags are invisible in Cost Explorer until this step is done. On Azure, use Azure Policy to require tags at resource creation. On GCP, define a labeling standard and enforce it at the Terraform or deployment automation layer.
6. How do Savings Plans affect cloud cost visibility?
Savings Plans apply discounts at the billing layer, not at the resource level. The discount appears as a negative line item against on-demand spend rather than mapping automatically to the specific teams or services it covers. Attributing Savings Plan discounts to specific teams requires either pro-rated allocation in your visibility platform or manual billing analysis. AWS Cost Explorer has Savings Plans utilization and coverage reports that help track performance, but team-level attribution requires additional configuration.
7. Do I need a third-party tool or are native cloud tools enough?
For single-cloud environments under $500K/month with consistent tagging, native tools cover most reporting needs. The clear triggers for adding a third-party platform are: multi-cloud environments (no native consolidated view), Kubernetes at scale (no native workload-level attribution), finance chargeback requirements (native export formats rarely match finance system expectations), and commitment coverage above 60% where manual RI/SP management consumes more analyst time than a platform fee.