.png)


Showback and chargeback are the two dominant cloud cost allocation models in enterprise FinOps. The core difference: showback informs, chargeback moves money. But every organization that has tried to implement either model at scale knows the real complexity starts after you make that choice.
This post covers what each model is, how they differ across five practical dimensions, what the real implementation failure points are, and how to use a decision framework to pick the right approach for your organization’s current state. It also addresses the allocation problem that none of the definition-level posts cover: what happens to shared commitment discounts when you try to do this at scale.
What Is Cloud Showback?
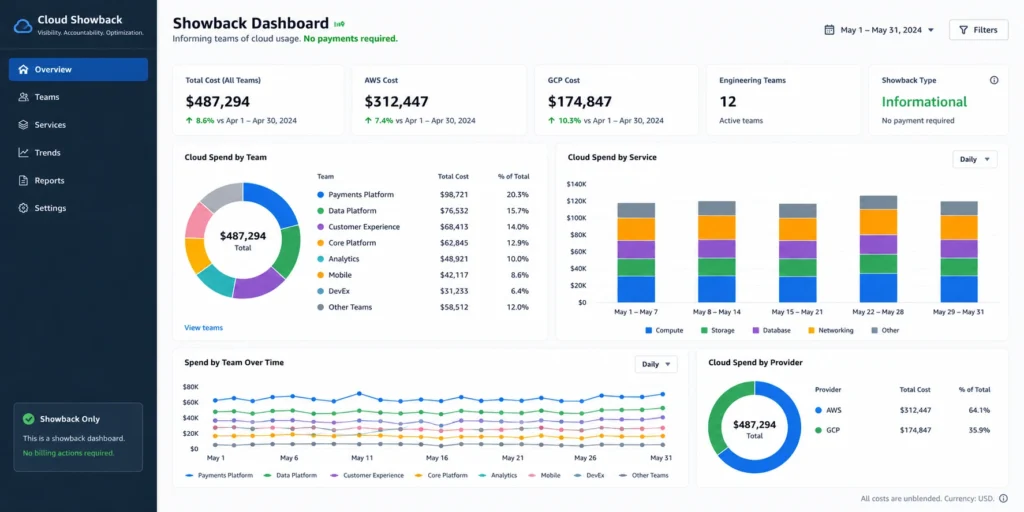
Showback is a cost visibility method where IT or FinOps teams track resource consumption by team, department, product, or cost center and report those costs, without billing anyone. The cloud bill stays on the central IT or payer account. Teams receive a report showing what they would have been charged if costs were allocated to them.
The goal is to educate teams on their spending footprint without triggering internal political friction from surprise invoices.
Showback works best when:
- Resource tagging is incomplete or inconsistent
- The organization is in the early stages of its FinOps journey
- Engineering and Finance teams have not yet agreed on internal billing mechanics
- Leadership wants to build cost awareness before enforcing accountability
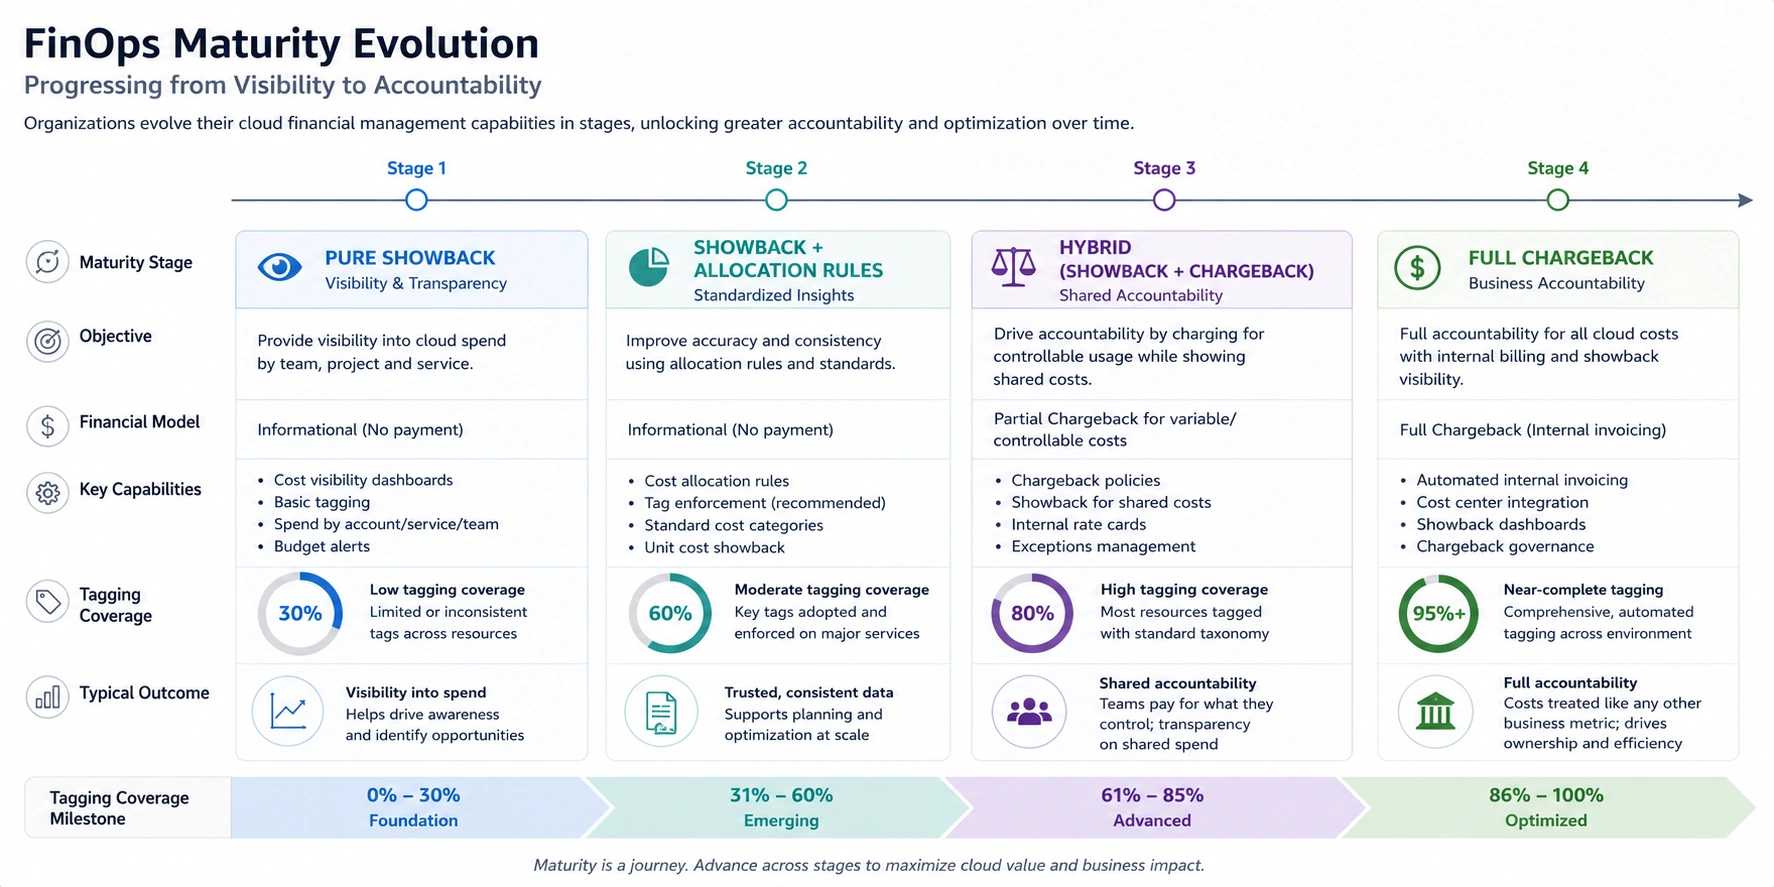
| Showback: A cost reporting method that distributes cloud usage data to teams or business units for transparency and awareness purposes. No budget transfers occur. Showback is typically the first step in building a cloud cost-conscious culture and is classified within the Inform phase of the FinOps Framework. |
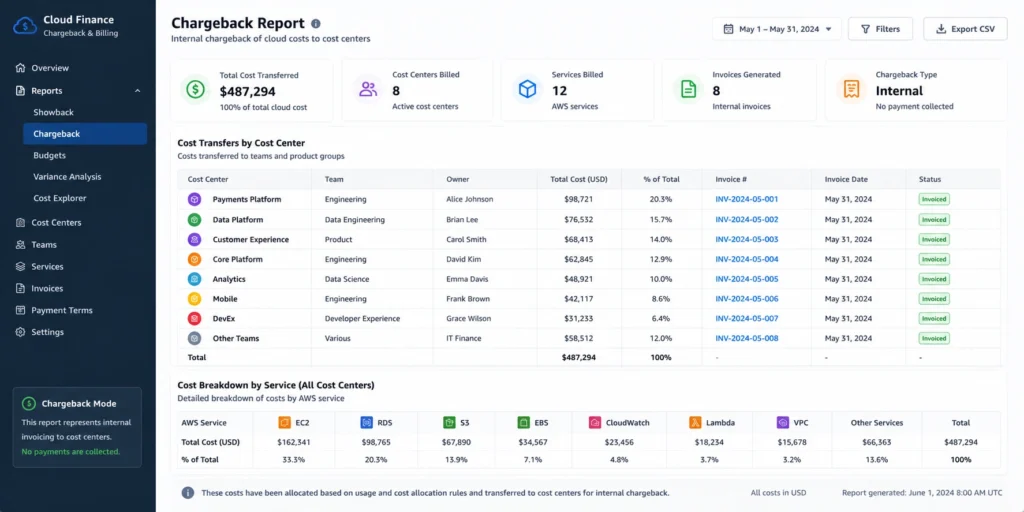
What Is Cloud Chargeback?
Chargeback is a cost accountability method where cloud costs are actively transferred from a central IT budget and invoiced, internally to the consuming team, department, or business unit. Costs move in the general ledger or affect the consuming team’s P&L.
IT operates as an internal service provider. Teams are financially accountable for the infrastructure decisions they make.
Chargeback works best when:
- Resource tagging covers 90%+ of spend
- Finance has internal billing infrastructure capable of accepting cost transfers
- Leadership has alignment across Engineering, Finance, and Business Unit heads
- The organization wants to drive behavioral change through direct financial consequences
| Chargeback definition (citable): A cost accountability method where cloud expenses are reallocated from a central IT or payer account to the business unit, team, or department that consumed the resources. Budget transfers occur in the general ledger. Chargeback is classified as a formal capability within the FinOps Framework under Chargeback and Finance Integration. |
Chargeback vs Showback: The 7-Dimension Comparison
The definitions are easy. Here is where the practical difference actually matters:
| Dimension | Showback | Chargeback |
| Money movement | No budget transfer; informational only | Costs move to team budget or P&L |
| Primary audience | Engineers, FinOps practitioners, department heads | Finance teams, executives, budget owners |
| Tagging requirement | Partial tagging sufficient (60-70%+ coverage workable) | Requires 90%+ tagging accuracy before implementation |
| Organizational friction | Low; nobody loses budget | High; departments resist absorbing previously centralized costs |
| Behavioral impact | Encourages self-optimization through awareness | Forces budget discipline through direct financial consequences |
| Implementation complexity | Low; dashboard + report generation | High; requires general ledger integration, internal billing workflows |
| FinOps maturity required | Crawl phase (FinOps Foundation model) | Walk-to-Run phase |
The Behavioral Difference Is What Matters Most
Showback produces awareness. Chargeback produces action but only when the person reading the chargeback report has budget authority and a financial reason to care. An engineer who sees a showback report showing their team spent $40,000 last month on RDS might flag it to their manager. A VP of Engineering who receives a chargeback invoice showing $40,000 debited from their Q3 headcount budget will schedule a rightsizing review the same week.
That is the behavioral mechanism. The financial consequence creates a different level of urgency than the informational report.
What Neither Model Covers: The Commitment Discount Allocation Problem
When a FinOps team purchases Reserved Instances or Savings Plans in a central payer account, those discounts apply across the organization. But when you run showback or chargeback reports, the question becomes: who gets credit for the savings?
Scenario: Your central payer account holds a 1-year Compute Savings Plan that covers EC2 spend across three product teams. Each team sees their on-demand EC2 spend in the billing console. But the Savings Plan discount is applied at the account level, not per team. If you run naïve showback by pulling raw billing data per team, each team sees inflated on-demand costs because the discount is not being attributed back to them. Your showback report is technically wrong.
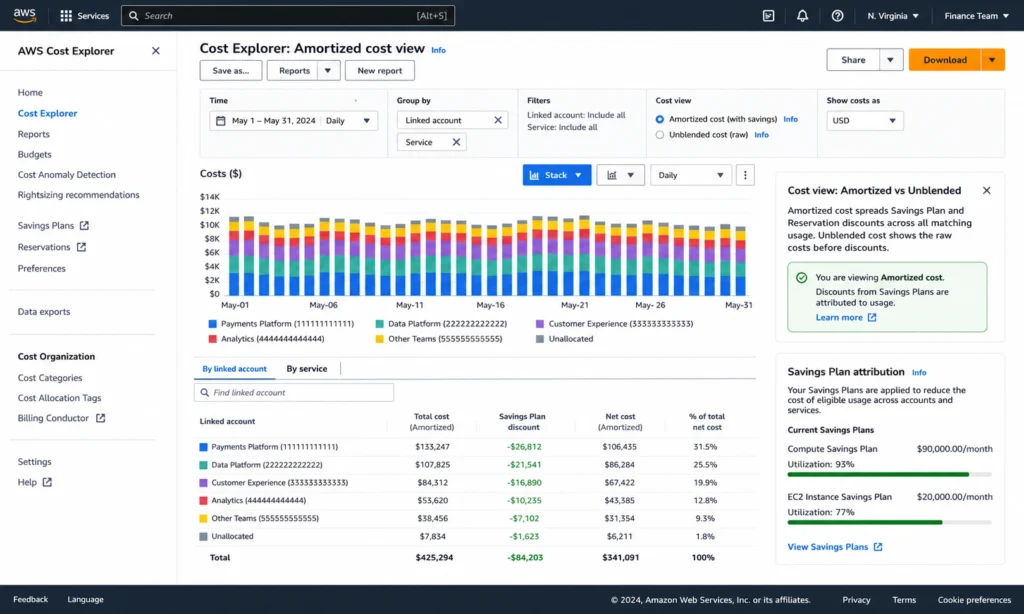
The correct approach requires proportional discount attribution, distributing Savings Plan savings back to teams based on their share of covered compute spend. This calculation changes every month as team usage patterns shift.
Most cloud consoles do not do this automatically. AWS Cost Explorer can be configured to show amortized costs with Savings Plan attribution, which helps (verify at Amazon Cost Management docs). GCP has a similar capability through Cloud Billing export to BigQuery. But the tooling to automate this attribution at a multi-team level still requires either significant custom work or a platform built for it.
This is the point where most showback programs stall. Teams see reports that do not reflect the actual discounted cost they incurred, finance flags the discrepancy, and the credibility of the entire cost allocation program takes a hit.
How to Implement Showback: A Practical Framework
Showback implementation has four prerequisites before you generate a single report.
Step 1: Establish a Tagging Strategy
Define the tag keys your organization will enforce. At minimum: team, environment, product, and cost-center. Tag consistency matters more than tag completeness at this stage. A team with 70% tagged resources and consistent key names will have more actionable showback data than a team with 95% tagged resources across six different naming conventions.
AWS recommends a tag policy managed through AWS Organizations to enforce consistency across accounts. GCP equivalents are managed through Resource Labels and enforced via Organization Policy constraints.
Step 2: Choose Your Cost Attribution Method
You have three options, each with different accuracy and effort profiles:
Amortized cost: Spreads upfront RI and Savings Plan costs evenly over the commitment term. Most accurate for showing teams their true blended cost. This is the recommended approach for showback. Enable amortized costs in AWS Cost Explorer or via CUR (Cost and Usage Report) configuration. Also see: Understanding Savings Plan Amortized Cost in AWS Cost Explorer.
Unblended cost: Shows the actual rate charged for each resource at the time of use. Simpler but misleads teams when Savings Plans or RIs are in play, some resources appear more expensive than they are because the discount is sitting in a different line item.
Blended cost: AWS-specific averaging method. Deprecated in favor of amortized for most use cases. Avoid unless your finance team has specific reasons to use it.
Step 3: Build the Report Distribution Workflow
A showback report that takes three days to generate monthly is not sustainable. Define:
- Report cadence: weekly is better than monthly for catching waste early
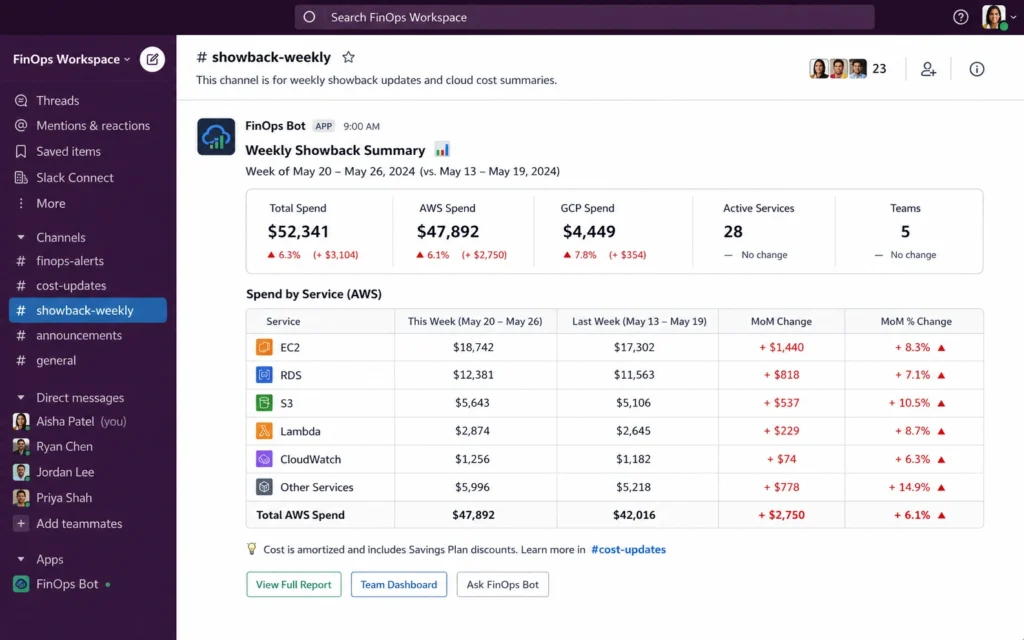
- Distribution method: Slack notification, email summary, or dashboard access
- Report format: per-service breakdown by team, with month-over-month comparison
Step 4: Establish a Review Cadence
Showback data without a review process produces awareness without action. Assign a FinOps practitioner or engineering manager to review team-level spend monthly. Define what “acting on the data” looks like — idle resource cleanup, right-sizing requests, scheduling non-production shutdown.
How to Implement Chargeback: What It Actually Takes
Chargeback sounds simple; bill the teams for what they use. The implementation complexity is why most organizations stay on showback longer than intended.
Prerequisites Before You Charge Anyone
Tagging coverage above 90%. If more than 10% of your cloud spend cannot be attributed to a specific team or cost center, your chargeback invoices will immediately be disputed. Engineering teams are good at identifying when a number is wrong, and one credibility failure in month one will set the program back by quarters.
Finance system integration. Chargeback requires that cost data flow into the financial systems that process internal transfers, Oracle, SAP, NetSuite, or your general ledger. This is not a dashboard problem; it is a finance infrastructure problem. Budget 6-12 weeks for this integration in a mid-market company.
Internal billing rate card. You need to define the rate at which you will charge teams. Options:
- Pass-through: charge teams the actual cloud rate with no markup
- Fully burdened: include overhead costs (FinOps team time, tooling licenses)
- Blended rate: use an internal price per compute unit that simplifies invoicing
Organizational alignment. Chargeback creates winners and losers internally, teams that were previously spending from a central IT budget now see those costs on their own P&L. This shift requires executive alignment before the first invoice goes out, not after.
Shared Cost Allocation Under Chargeback
Shared services like Kubernetes clusters, monitoring platforms, data pipelines, security tools, cannot be tagged to a single team but still need to be charged back. Three common approaches:
- Even split: Divide shared costs equally across all consuming teams. Simple but penalizes small teams.
- Usage-proportional split: Allocate based on each team’s share of total workload metrics (CPU hours, requests, storage). More accurate but requires metric instrumentation.
- Fixed rate: Charge a fixed monthly rate per team for shared service access, regardless of actual consumption. Predictable for budget planning.
The FinOps Foundation’s guidance on shared cost allocation is the most thorough publicly available treatment of this problem.
Chargeback vs Showback Decision Tree
Use this framework to determine where to start:
START HERE
|
Does your organization have a consistent tagging strategy?
|
NO –> Start with Showback.
Build tagging governance first.
Set a 6-month target to reach 80% coverage.
Re-evaluate at 6 months.
|
YES –> What is your current tagging coverage?
|
Under 80% –> Showback. Coverage too low for credible chargeback.
|
80-90% –> Showback with chargeback pilots.
Run chargeback for 1-2 well-tagged product teams only.
Use showback for everything else.
|
Above 90% –> Ready for chargeback.
Confirm finance system integration is in place.
Confirm executive alignment exists.
Launch chargeback with a 30-day dispute resolution process.
Additional decision factors:
Run showback when:
- You are pre-FinOps or in the Crawl phase
- Engineering leadership is not yet engaged on cloud costs
- Your organization has fewer than 3 cloud accounts
- You are building internal trust with cost data before enforcing accountability
Run chargeback when:
- Business units have P&L ownership and cloud costs are material to margin
- Engineering teams have shown they respond to informational reports with inaction
- Finance requires that IT costs are directly attributed to product lines for COGS calculation
- Your cloud spend is above $500K/month and growing faster than headcount
Run both simultaneously when:
- Different business units are at different FinOps maturity levels
- Some workloads are fully tagged and others are not
- You want to graduate teams to chargeback incrementally rather than all at once
The Evolution Path: From Showback to Chargeback
Most mature FinOps programs do not choose between showback and chargeback — they evolve through a sequence and run both in parallel for different workloads.
- Phase 1 (Months 1-6): Instrumentation Deploy tagging strategy. Enable billing data export to your analytics tool of choice. Generate first showback reports. Identify the 20-30% of spend that is untagged and build a plan to attribute it.
- Phase 2 (Months 6-12): Showback at Scale All teams receive monthly or weekly showback reports. FinOps practitioner or engineering manager assigned to review. Tagging coverage reaches 80%+. Teams begin self-optimizing based on visibility alone. Establish baseline unit economics: $/request, $/user, $/transaction.
- Phase 3 (Months 12-18): Chargeback Pilots Select 2-3 teams with the highest tagging coverage and most cost-conscious engineering culture. Introduce chargeback for their workloads. Run a showback for everyone else. Measure behavioral change like do rightsizing requests increase? Do idle resources get cleaned up faster?
- Phase 4 (Months 18+): Chargeback at Scale Expand chargeback to all teams meeting the 90% tagging threshold. Maintain showback for shared services and unattributable costs. Build a formal dispute resolution process, teams will challenge invoices, and having a clear process prevents escalations.
Common Implementation Failures (and How to Avoid Them)
Failure 1: Starting Chargeback Before Tagging Is Ready
The most common mistake. A CFO mandates chargeback in Q1. FinOps team implements it with 65% tagging coverage. Engineering teams receive invoices they cannot reconcile. Disputes consume more time than the cost savings justify. Program loses credibility and reverts to showback.
Fix: Do not launch chargeback until tagging coverage is above 90% for the workloads being charged back. Use a tagging compliance dashboard to track progress before the go-live date.
Failure 2: Using Unblended Costs for Showback When Commitments Are in Play
Teams see showback reports showing on-demand pricing for resources that are actually covered by Savings Plans. Reports look inflated. Teams distrust the data. Finance questions the accuracy. The whole program stalls while IT tries to explain the difference between unblended and amortized costs to a room of skeptical engineering managers.
Fix: Always use amortized costs for showback and chargeback reports when Savings Plans or Reserved Instances are active. Configure Cost and Usage Reports (CUR) to include amortized cost columns.
Failure 3: No Dispute Resolution Process
Chargeback invoices get challenged. This is normal and healthy, teams catching billing errors is part of the governance benefit. But without a defined dispute process, every challenge becomes an escalation.
Fix: Define a 10-business-day dispute window. Designate a FinOps practitioner as the dispute resolver. Document the methodology so teams can audit their own charges.
Failure 4: Ignoring Shared Services
Allocating 70% of costs to teams and leaving 30% in a shared services bucket means your chargeback numbers will always underreport true team costs. Finance will not accept partial attribution indefinitely.
Fix: Define a shared cost allocation methodology before launch. Document it. Apply it consistently. Review it quarterly as team size and consumption patterns shift.
How Automation Changes What Is Feasible
Manual showback and chargeback processes hit a ceiling fast. Generating reports from CUR exports, distributing them via email, and reconciling disputes through spreadsheets is feasible for organizations with 2-3 teams. At 10+ teams, 3+ cloud accounts, and mixed AWS/GCP/Azure environments, the manual approach consumes more FinOps practitioner time than it saves.
This is where platform tooling becomes a practical requirement rather than a nice-to-have.
For organizations managing commitment discounts alongside cost allocation, the tooling question gets more specific. Savings Plans and Reserved Instances purchased at the payer account level need to be attributed back to teams as part of any credible showback or chargeback program. Platforms that automate commitment purchasing need to also automate that attribution — otherwise FinOps teams end up maintaining two separate systems with data that does not reconcile.
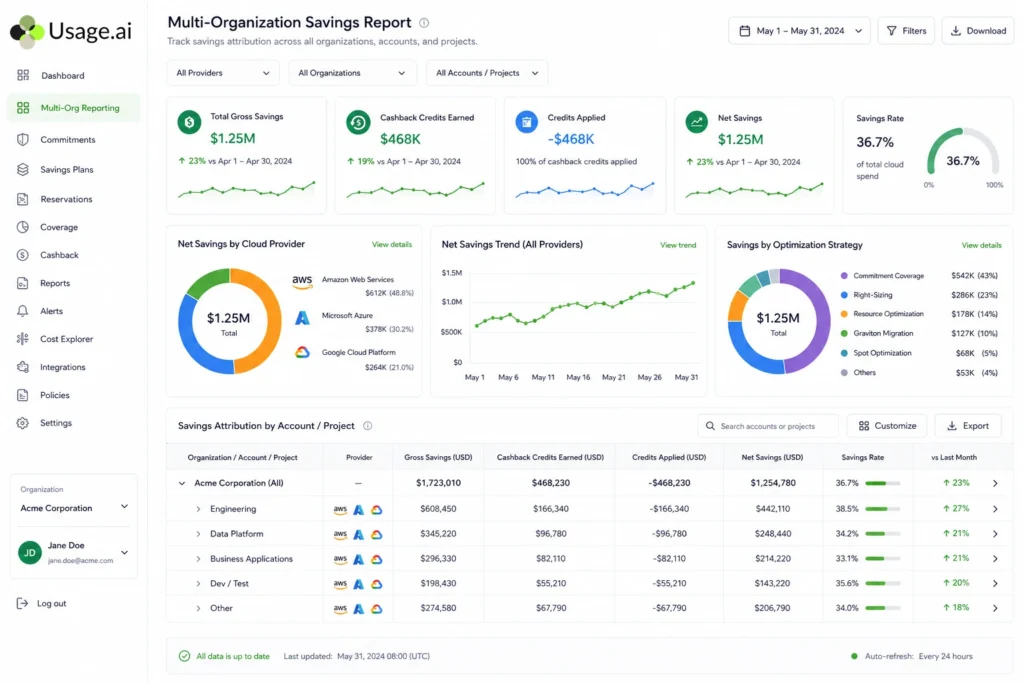
Usage.ai includes Multi-Org Reporting and Showback Support as platform capabilities across AWS, GCP, and Azure. This means commitment savings purchased through the platform can be reported back at the team or account level, which addresses the attribution gap that manual showback programs typically cannot resolve cleanly. The platform operates at the billing layer only, no infrastructure changes required with a 30-minute setup. See how Usage.ai works.
For teams that want to evaluate commitment automation alongside cost allocation tooling, the key question to ask any vendor is: “How do you attribute Savings Plan and Reserved Instance savings back to individual teams in your showback reports?” If the answer is “we show amortized cost per account,” that is a minimum viable answer. If the answer is “we do not support multi-team attribution,” that is a gap that will become a problem as your program matures.
Showback vs Chargeback: Choose Your Model Based on These Criteria
Choose Showback When:
- Your FinOps program is under 12 months old
- Resource tagging covers less than 80% of spend
- You need to build internal trust with cost data before enforcing accountability
- Engineering teams are not yet responsive to cost visibility — showback is the tool that creates that culture
- You have shared infrastructure with no clear team ownership
- Your cloud bill is below $200K/month and does not yet justify the finance infrastructure investment
Choose Chargeback When:
- Business units operate with P&L ownership and cloud is a material cost of goods
- You have been running showback for 6+ months and teams are still not self-optimizing
- Finance requires direct cost attribution for COGS reporting, margin calculation, or product-level P&L
- Resource tagging is above 90% and auditable
- You have executive alignment across Engineering, Finance, and Business Unit leadership
- Your cloud spend is above $500K/month and growing faster than revenue
Run Both Simultaneously When:
- Different teams or products are at different FinOps maturity levels
- Some workloads are fully tagged and others share infrastructure
- You are mid-migration and want to graduate teams incrementally
- You want to use showback as the accountability mechanism for shared services while chargeback applies to team-owned workloads
Before you read the FAQ, find out exactly how much your current AWS setup is leaving on the table. Run a free savings estimate with Usage.ai’s AWS Savings Calculator.
Frequently Asked Questions
1. What is the difference between chargeback and showback in FinOps?
Showback distributes cloud cost visibility to teams without moving money, costs stay on the central IT budget. Chargeback transfers those costs directly to the consuming team’s budget or P&L. The FinOps Foundation classifies Chargeback and Finance Integration as a formal capability in the Inform phase. The practical difference is accountability: showback informs, chargeback enforces. Most mature FinOps programs use both, applying chargeback to well-tagged product workloads and showback to shared services.
2. What tagging coverage is required before implementing chargeback?
The widely cited threshold is 90% tagging coverage across billable resources before launching chargeback. Below 90%, too many costs land in an unattributed bucket, making invoices disputeable and inaccurate. At 80-90% coverage, a hybrid approach works: chargeback for fully tagged workloads, showback for partially tagged resources. Building tagging governance through AWS Organizations tag policies or GCP Organization Policy constraints is the prerequisite work, not the billing configuration.
3. How do you handle Reserved Instances and Savings Plans in showback reports?
Use amortized costs rather than unblended costs when Reserved Instances or Savings Plans are active. Amortized cost spreads the commitment price evenly over the term and attributes discounts proportionally to the resources they cover. AWS Cost Explorer supports amortized cost views, and AWS CUR includes amortized cost columns when configured. GCP Cloud Billing export to BigQuery provides similar attribution capability. Running showback on unblended costs when commitments exist produces reports that appear inflated and lose team trust quickly.
4. Is chargeback required for FinOps maturity?
No. The FinOps Foundation’s maturity model does not require chargeback, it recognizes Chargeback and Finance Integration as a capability that organizations adopt based on their structure, not a requirement for advancing maturity levels. Many organizations with sophisticated FinOps practices run showback only. Chargeback makes sense when P&L ownership exists at the business unit level and cloud costs are material to product margins. For centralized engineering organizations without P&L separation, showback often produces equivalent behavioral outcomes without the overhead.
5. What is the hardest part of implementing chargeback?
The two most commonly cited obstacles are tagging completeness and organizational alignment. Tagging gaps mean invoices cannot be fully attributed, creating disputes. Organizational alignment is harder, chargeback moves costs from a central IT budget to team P&Ls, which always generates resistance from teams absorbing previously invisible costs. The technical implementation is straightforward compared to the political work of getting Business Unit heads, Finance, and Engineering leadership aligned before the first invoice goes out.
6. How do you allocate shared services costs under chargeback?
Three methods are standard. Even split divides shared costs equally across consuming teams — simple but penalizes small teams. Usage-proportional split allocates based on each team’s share of a workload metric like CPU hours or API requests — more accurate but requires instrumentation. Fixed-rate allocation charges a standard monthly rate per team for access to shared services — predictable for budgeting but does not reflect actual consumption. The right choice depends on your organization’s billing culture: finance teams that prioritize accuracy prefer usage-proportional, teams that prioritize predictability prefer fixed-rate.
7. Can you run showback and chargeback at the same time?
Yes, this is the most common configuration in mature FinOps programs. Apply chargeback to teams that have 90%+ tagging coverage and clearly owned workloads. Apply showback to shared infrastructure, partially-tagged environments, and teams earlier in their FinOps journey. Using both simultaneously lets you graduate teams incrementally as their tagging matures rather than forcing an all-or-nothing transition. Most enterprise organizations with multiple business units at different maturity levels end up here by default.
8. What is the difference between showback and a cloud cost dashboard?
A cloud cost dashboard shows raw spend data without team-level attribution. Showback requires that data to be allocated by team, department, product, or cost center, it is a cost attribution exercise on top of the underlying billing data. A Cost Explorer view showing total AWS spend is a dashboard. That same data broken down by engineering team with ownership metadata applied is showback. The distinction matters because showback requires a tagging strategy, an attribution methodology, and a distribution mechanism that a raw dashboard does not.