.png)


Managing AWS costs can feel overwhelming once your infrastructure starts scaling. Two native AWS tools are commonly used to monitor and analyze spending: AWS Budgets and AWS Cost Explorer.
Both are part of AWS Cost Management and provide forecasting. They also reference Savings Plans and Reserved Instances. But the difference between AWS Budgets and Cost Explorer is fundamental.
AWS Budgets helps you set spending guardrails and receive alerts.AWS Cost Explorer helps you analyze and break down where your money is going.
In this guide, we’ll break down AWS Budgets vs Cost Explorer in detail, including features, forecasting behavior, utilization tracking, filtering capabilities, and real-world use cases so you know exactly when to use each.
What Is AWS Budgets?
AWS Budgets is a cost monitoring and alerting tool that allows you to set spending, usage, and commitment utilization thresholds and receive notifications when those thresholds are exceeded.
AWS Budgets is part of AWS Cost Management. Its primary purpose is to act as a financial guardrails helping teams detect when cloud costs, usage levels, or commitment performance move outside planned limits.
It does not analyze cost breakdowns in depth. Instead, it monitors predefined targets and alerts you when those targets are crossed.
Also read: 7 AWS Savings Plan KPIs Every FinOps Team Should Track
Core Function of AWS Budgets
At its core, AWS Budgets answers the question: Are we staying within the limits we planned?
You define a cost, usage, or commitment performance target for a specific time period, like monthly, quarterly, or annually. AWS then continuously evaluates your actual and forecasted performance against that predefined threshold.
If your spending, usage, or commitment utilization crosses the limit you set, AWS Budgets triggers a notification.
There is no investigative workflow built into the tool. It does not explain why costs changed. It does not break down root causes. Instead, it acts as a monitoring and alert layer on top of your AWS billing data.
Think of it as a financial tripwire: once crossed, you’re alerted, but the investigation happens elsewhere.
Source: AWS Amazon Docs
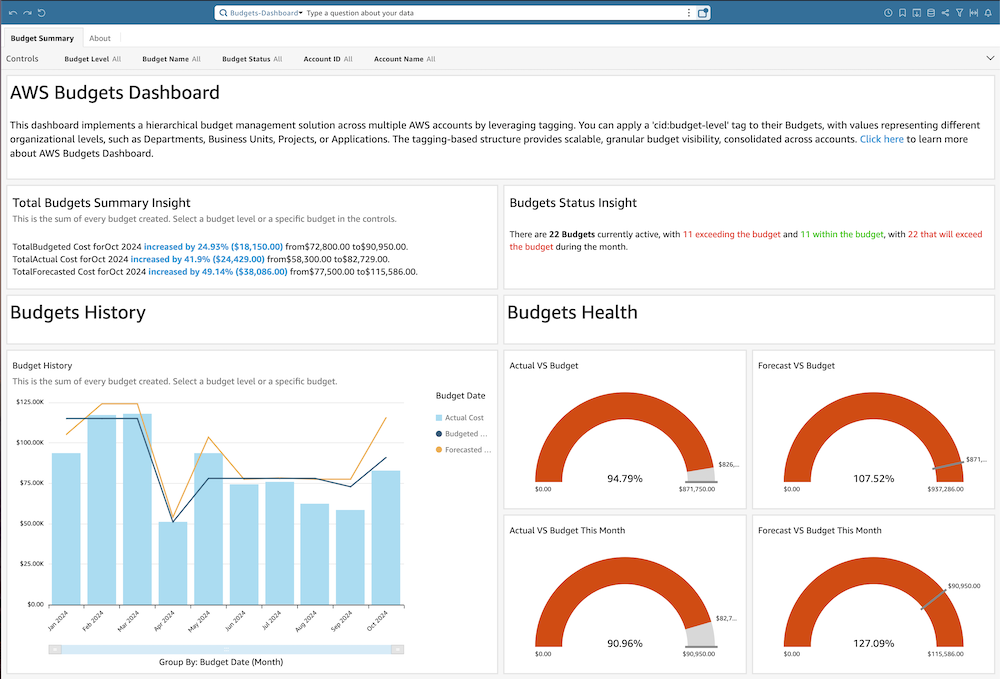
In the AWS Budgets dashboard, you define the spending threshold, select filters (such as service or account), and configure alert triggers. The forecast graph shows projected spend based on historical trends, and alert thresholds appear visually against actual and forecasted values.
In the AWS Budgets dashboard, you define the spending threshold, select filters (such as service or account), and configure alert triggers. The forecast graph shows projected spend based on historical trends, and alert thresholds appear visually against actual and forecasted values.
This visual layout reinforces the tool’s primary function of monitoring performance against a predefined financial boundary.
Also read: How to Identify Idle & Underutilized AWS Resources
Types of AWS Budgets
AWS Budgets supports multiple budget types, but they all operate on the same underlying principle of evaluating a defined billing dimension against a fixed threshold over a defined time period.
The difference between the budget types is what billing metric is being evaluated.
To understand AWS Budgets properly, you need to understand how AWS billing data is structured. AWS billing aggregates cost and usage data across services, accounts, regions, purchase options, and commitment instruments (Savings Plans and Reserved Instances). Budgets allows you to select a subset of that data and attach a threshold to it.
Each budget type simply attaches a threshold to a different metric.
Here are the supported budget types:
1. Cost Budgets (Spend-Based Thresholds)
Cost Budgets evaluate monetary spend. Behind the scenes, AWS Budgets pulls data from Cost Explorer’s billing dataset and evaluates:
- Unblended cost
- Amortized cost
- Blended cost (in consolidated billing)
- Net unblended cost (after credits)
You can filter this cost by:
- Linked account
- Service
- Region
- Tag
- Cost category
- Instance type
- Purchase option (On-Demand vs RI vs SP)
Then you attach a threshold, for example:
- $100,000 monthly limit
- $25,000 quarterly cap
Budgets then calculates:
- Actual cost to date
- Forecasted cost for the full period
And compares both against your defined limit.
2. Usage Budgets (Consumption-Based Monitoring)
Usage Budgets evaluate raw usage metrics, like EC2 instance hours, Data transfer (GB), API request counts and Lambda invocations.
In many organizations, engineering teams want to monitor scaling behavior before it impacts cost. Usage Budgets allow you to:
- Detect infrastructure growth early
- Monitor environment-specific scaling
- Catch runaway automation before the invoice spikes
Usage Budgets are especially useful when pricing varies (for example, if commitment coverage changes effective cost).
But again, budgets will not break down which workload increases usage. It simply alerts when usage crosses the defined threshold.
3. Commitment Utilization Budgets (Efficiency Monitoring)
Commitment Utilization Budgets monitor how effectively your prepaid cloud commitments, Savings Plans or Reserved Instances are being consumed.
When you purchase a Savings Plan or Reserved Instance, you commit to a fixed hourly spend (for example, $10/hour) in exchange for discounted pricing. AWS continuously matches eligible usage against that committed amount.
Utilization measures what percentage of the committed hourly spend is actually being consumed by eligible usage.
If you commit to $10/hour but only generate $7/hour of matching usage, your utilization is 70%. The remaining 30% is effectively wasted and you are paying for unused commitment capacity.
From a billing perspective:
- Savings Plans apply first to eligible usage.
- Any unused commitment still charges at the committed rate.
- Underutilization reduces the effective discount achieved.
This makes utilization a capital efficiency metric.
Also read: How to Choose Between 1-Year and 3-Year AWS Commitments
4. Commitment Coverage Budgets (Protection Monitoring)
Commitment Coverage Budgets measure how much of your eligible compute usage is protected by discounted pricing through Savings Plans or Reserved Instances.
Unlike utilization, which measures how efficiently purchased commitments are consumed, coverage measures exposure to on-demand pricing.
Coverage answers a different question: Of our total eligible compute usage, what percentage is protected by commitments?
For example, if your workloads generate $100/hour in eligible compute spend and only $60/hour is covered by Savings Plans or Reserved Instances, your coverage is 60%. The remaining 40% is billed at on-demand rates.
From a billing perspective:
- Eligible usage is first matched against active commitments.
- Any remaining unmatched usage is charged at standard on-demand pricing.
- Higher coverage generally increases realized discount rates.
This makes coverage a pricing protection metric.
How AWS Budgets Processes Billing Data
AWS Budgets does not generate its own billing data. It evaluates data that already exists within AWS’s Cost Management system.
AWS Budgets pulls from the same underlying billing dataset used by AWS Cost Explorer and the Cost & Usage Report (CUR). This dataset includes:
- Service-level spend
- Usage quantities
- Linked account allocations
- Purchase option data (On-Demand, Savings Plans, Reserved Instances)
- Tag and cost category dimensions
- Amortized and unblended cost views
When you create a budget, you are essentially defining a filtered query on that dataset and attaching a threshold to it.
Step 1: Data Aggregation
AWS aggregates billing and usage data across all linked accounts (if consolidated billing is enabled), all services, all regions and all pricing instruments.
This aggregation typically updates multiple times per day, but finalized billing data stabilizes at the daily level.
Step 2: Filter Application
When creating a budget, you can apply filters such as:
- Service (e.g., EC2 only)
- Linked account
- Tag key/value
- Region
- Instance type
- Cost category
- Purchase option
These filters define the exact slice of billing data that Budgets will monitor.
For example, you might create a cost budget for:
- EC2
- Production account
- us-east-1 region
- Environment=Production tag
Budgets continuously evaluates that filtered dataset against your threshold.
Step 3: Threshold Evaluation
Once filters are applied, AWS Budgets evaluates two primary metrics:
- Actual cost or usage to date
- Forecasted cost or projected utilization
If either metric exceeds the threshold you defined, an alert is triggered.
Evaluation cadence include:
- Billing data refreshes multiple times daily
- Forecast recalculates daily
- Alerts trigger when thresholds are crossed
This means Budgets operates on near-real-time billing updates and not instantaneous infrastructure telemetry.
Step 4: Forecast Calculation
Forecasting in AWS Budgets relies on historical spend trends within the defined time window.
The forecast model:
- Analyzes historical usage patterns
- Projects expected spend for the remainder of the budget period
- Recalculates daily
However, some limitations include:
- It does not simulate planned infrastructure changes
- It does not incorporate upcoming commitment purchases
- It does not factor engineering deployment roadmaps
Step 5: Commitment Metric Evaluation
For utilization and coverage budgets, the system evaluates commitment matching logic:
- Savings Plans are applied first to eligible compute usage
- Reserved Instances apply to matching instance attributes
- Remaining unmatched usage is billed on-demand
Budgets reads these calculated billing outcomes and evaluates:
- Percentage of committed spend consumed (utilization)
- Percentage of eligible usage protected (coverage)
It does not influence matching logic, and only monitors results.
Also read: Why Cloud Cost Forecasting Breaks in Dynamic Environments
Alerting and Enforcement Mechanics (How AWS Budgets Actually Triggers Actions)
The defining capability of AWS Budgets is its alert engine. Once a budget is configured, AWS continuously evaluates the selected billing dataset against the defined threshold. When the monitored metric crosses that boundary, an alert is triggered.
There are two primary evaluation modes:
1. Actual Cost or Usage Alerts
These alerts trigger when real, accumulated cost or usage exceeds a defined percentage of the budget.
For example,
- Monthly budget: $100,000
- Alert threshold: 80%
- Alert triggers when actual spend exceeds $80,000
This is reactive monitoring and it fires after spend has already occurred.
2. Forecasted Alerts
Forecasted alerts trigger when AWS projects that total spend for the period will exceed the defined budget, even if the current actual spend has not yet crossed the threshold.
For example,
- Budget: $100,000
- Current spend: $65,000
- Forecasted end-of-month spend: $110,000
- Alert triggers based on forecast
This provides early warning, but depends entirely on historical trend modeling. Forecast alerts are recalculated daily, based on updated billing data.
Alert Delivery Mechanisms
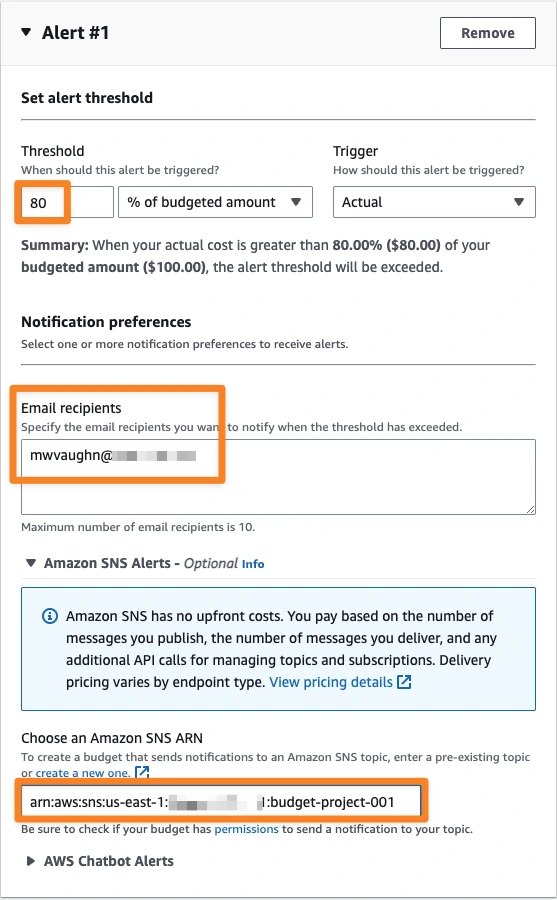
Source: Day1HPC
AWS Budgets supports two notification channels:
- Email notifications (direct to recipients)
- Amazon SNS topics (for automation or integration)
Using SNS, alerts can trigger:
- Lambda functions
- Slack integrations
- Ticketing systems
- Internal automation workflows
However, AWS Budgets itself does not perform automated cost optimization. It only emits signals.
Budget Actions (Enforcement Layer)
Beyond notifications, AWS Budgets also supports Budget Actions, which allow governance enforcement when thresholds are breached.
When configured, Budget Actions can:
- Apply IAM policies to users or roles
- Deny specific API actions
- Restrict the ability to launch new resources
For example, if a development account exceeds 110% of its monthly budget, AWS can automatically restrict the ability to launch new EC2 instances.
This transforms AWS Budgets from a passive alerting system into an enforceable financial control mechanism. However, Budget Actions must be explicitly configured and carefully scoped to avoid unintended operational impact.
Operational Reality
It is important to understand how AWS Budgets behaves in practice:
- Billing data is not real-time; updates occur multiple times daily.
- Alerts trigger after data refresh, not instantly at resource creation.
- Forecast-based alerts depend entirely on historical usage patterns.
- Enforcement actions apply at the IAM layer, not at the billing engine layer.
AWS Budgets is therefore an governance enforcement tool (if configured), but you cannot treat it as a commitment optimization engine.
What Is AWS Cost Explorer?
AWS Cost Explorer is a cost analysis and reporting tool that allows you to visualize, filter, and break down your AWS spending across services, accounts, regions, tags, and purchase options.
Where AWS Budgets attaches thresholds to billing metrics, Cost Explorer allows you to interactively query, group, filter, and visualize billing data across multiple dimensions.
Core Function of AWS Cost Explorer
When you use AWS Cost Explorer, you are interacting with AWS’s aggregated billing dataset through a dynamic query interface. Each report you generate follows a consistent analytical structure:
- Select a reporting period (custom range, monthly, daily, hourly granularity where supported)
- Choose a cost metric (Unblended Cost, Amortized Cost, Net Unblended Cost)
- Apply filters (service, linked account, tag, region, instance type, purchase option)
- Group results by a billing dimension
- Visualize results in graphical and tabular formats
This workflow turns Cost Explorer into a financial analysis tool. Unlike AWS Budgets, Cost Explorer does not attach thresholds or generate guardrail alerts. Instead, it enables users to drill into cost data and isolate the source of changes.
For example, if total monthly cost increased by 18%, Cost Explorer allows you to:
- Group by service to identify which service drove the increase
- Filter by tag to determine whether production or development workloads expanded
- Group by purchase option to evaluate on-demand exposure versus Savings Plans coverage
- Analyze daily or hourly granularity to detect timing patterns
This investigative capability is the defining characteristic of AWS Cost Explorer.
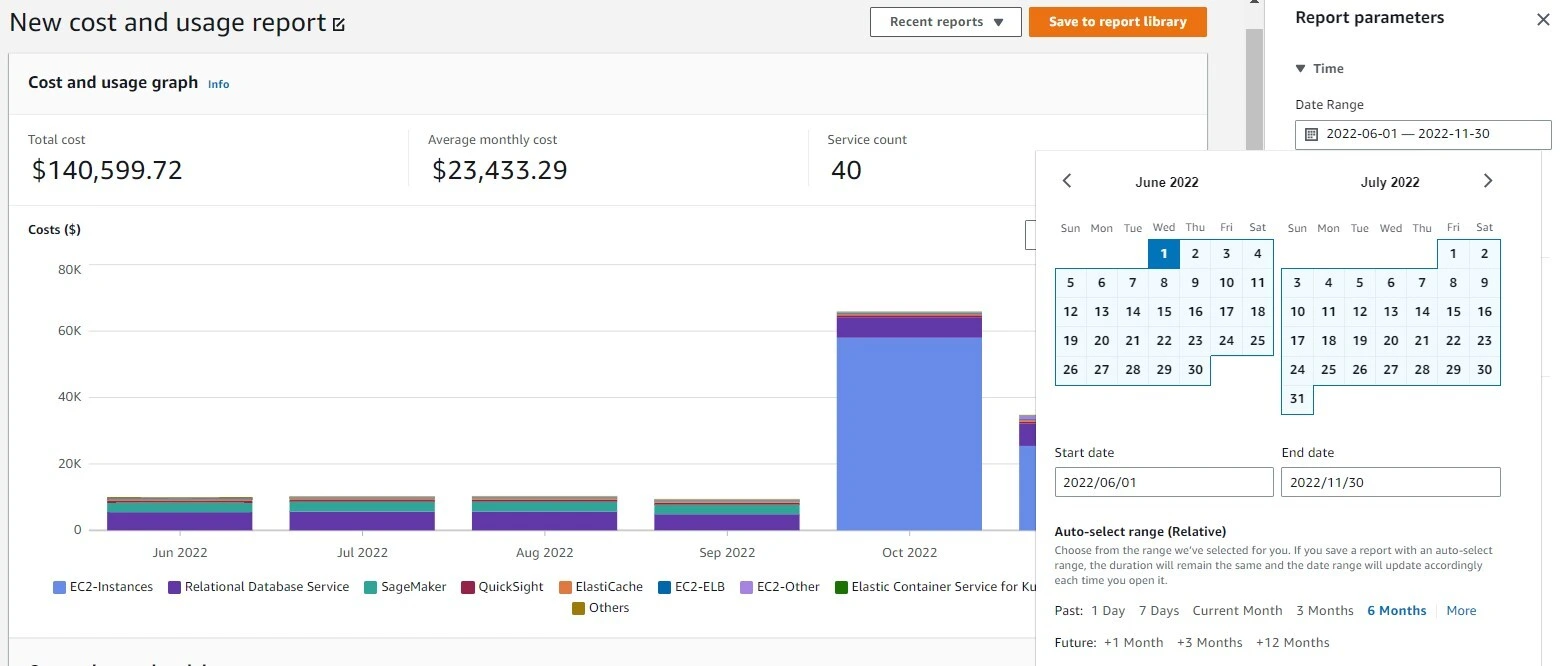
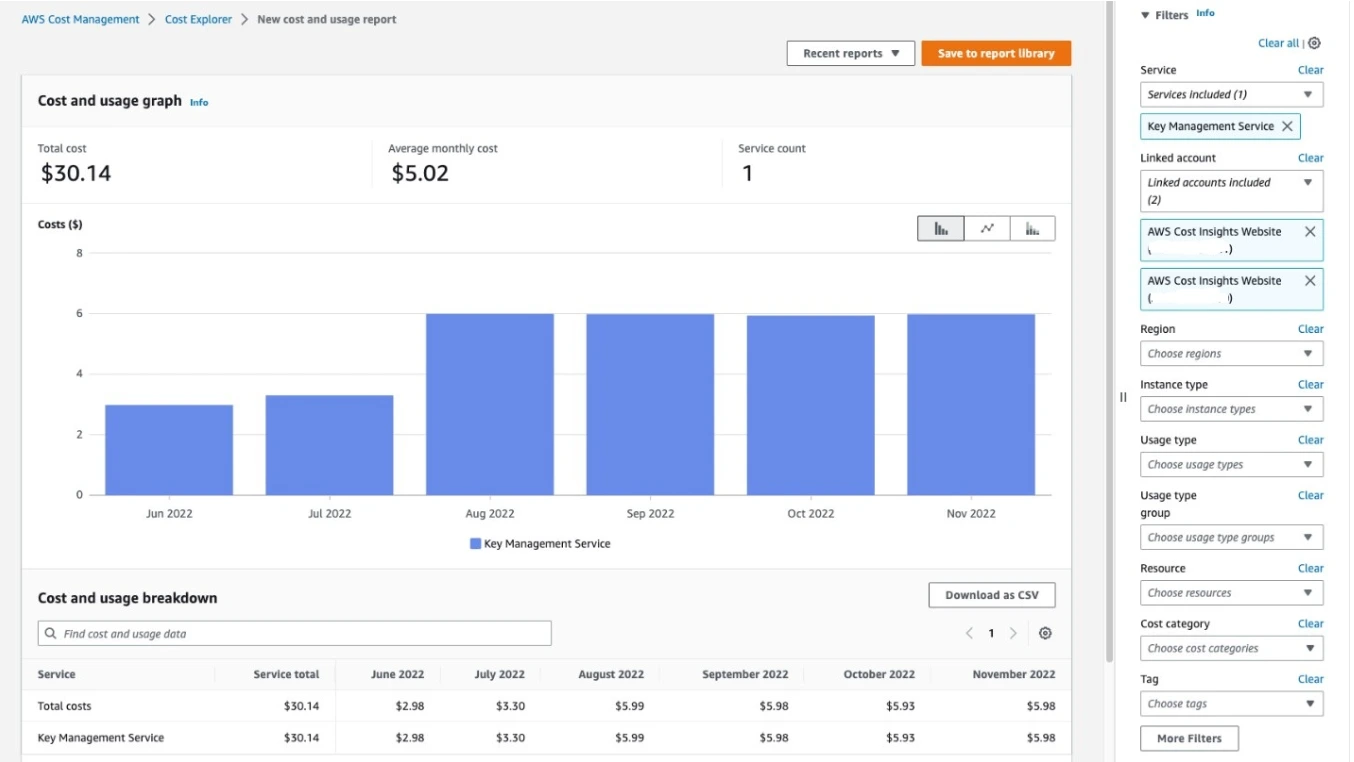
Source: AWS Amazon
Cost Metrics and Time Granularity in AWS Cost Explorer
One of the most important capabilities of AWS Cost Explorer and a key differentiator when evaluating AWS Budgets vs Cost Explorer is the level of control it provides over cost metrics and time granularity.
When generating a report in AWS Cost Explorer, you must select a cost metric. This determines how AWS calculates and displays the numbers. The primary cost metrics include:
1. Unblended Cost
This reflects the raw cost of usage without blending rates across accounts. It shows the direct price charged for usage in the selected time period.
Best for:
- Understanding actual invoice impact
- Reviewing service-level raw spend
2. Amortized Cost
Amortized cost spreads upfront commitment payments (Savings Plans or Reserved Instances) across the time period they apply to.
Instead of showing a large upfront purchase in one month, amortized cost distributes that expense proportionally over usage.
Best for:
- Evaluating effective pricing
- Measuring commitment performance
- Performing FinOps analysis
This metric is often preferred in mature cloud cost management practices because it reflects the true economic impact of commitments.
3. Net Unblended Cost
Net Unblended Cost includes credits and discounts applied to the account.
Best for:
- Understanding post-credit spend
- Evaluating promotional or enterprise discount impact
Source: AWS Amazon
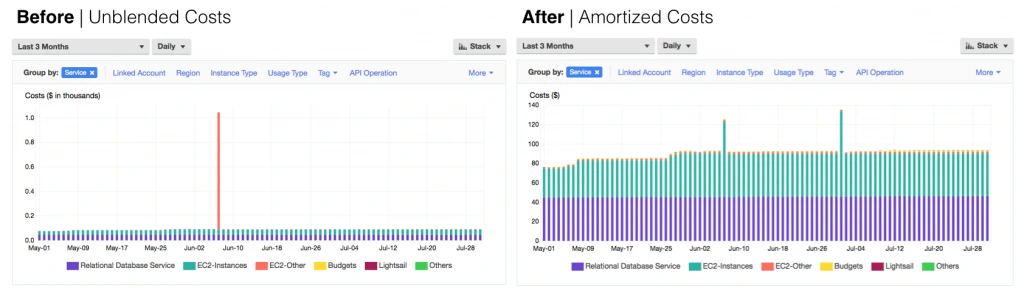
Why Cost Metric Selection Matters
In AWS Cost Explorer, selecting the wrong metric can lead to misleading conclusions, like:
- Viewing unblended cost may make commitment-heavy months look expensive due to upfront payments.
- Viewing amortized cost provides a normalized view of commitment economics.
- Comparing months using inconsistent metrics can distort trend analysis.
Cost Explorer allows you to toggle between these views dynamically, making it significantly more analytical than simple monitoring tools.
Also read: What is Cloud Cost Governance: Framework, Best Practices, and KPIs
Time Granularity: Monthly, Daily, and Hourly Views
Another core strength of AWS Cost Explorer is time resolution flexibility. You can view cost data at:
- Monthly granularity for high-level budgeting and trend tracking
- Daily granularity for identifying cost spikes or unusual behavior
- Hourly granularity (for supported services) for deep infrastructure analysis
This matters when investigating sudden cost increases. For example:
- Monthly view shows total increase.
- Daily view pinpoints the day of change.
- Hourly view may reveal a deployment event or scaling incident.
This layered time resolution transforms Cost Explorer from a reporting tool into an investigative instrument.
Understanding these mechanics is critical when comparing AWS Budgets vs Cost Explorer. Budgets monitor fixed limits, while Cost Explorer enables multidimensional cost analysis.
Filtering and Grouping Depth in AWS Cost Explorer
The true analytical power of AWS Cost Explorer lies in its filtering and grouping engine. This is what transforms it from a reporting interface into a multidimensional cost investigation tool.
When comparing AWS Budgets vs Cost Explorer, this is where the functional divergence becomes most apparent.
While AWS Budgets allows limited filtering for monitoring purposes, Cost Explorer enables dynamic dimensional slicing of billing data.
Source: AWS Amazon
Filtering: Isolating a Specific Slice of Spend
Filtering in AWS Cost Explorer allows you to restrict the billing dataset to a precise subset of usage before analysis begins.
You can filter by:
- Service (EC2, RDS, S3, Lambda, etc.)
- Linked account (within consolidated billing)
- Region
- Instance type
- Usage type
- API operation
- Tag key and value
- Cost category
- Purchase option (On-Demand, Reserved Instance, Savings Plan)
- Availability Zone (for certain services)
Filtering defines scope. It narrows the billing dataset before grouping or visualizing it.
For example, you could filter to:
- Service = EC2
- Tag = Environment:Production
- Region = us-east-1
- Purchase Option = On-Demand
This would isolate only production EC2 workloads in a specific region that are not covered by commitments.
That level of specificity is not available in AWS Budgets beyond threshold monitoring.
Grouping: Revealing Cost Distribution
After applying filters, you can group the resulting dataset by a specific billing dimension. Common grouping dimensions include:
- Service
- Linked account
- Region
- Instance type
- Tag
- Usage type
- Purchase option
For example, if total monthly cost increased by 15%, you could:
- Group by service → Identify which service drove the increase
- Then filter to that service
- Then group by tag → Identify which environment expanded
- Then group by purchase option → Determine on-demand exposure
This iterative grouping workflow allows layered investigation. It mimics how financial analysts slice and pivot cost data, but within AWS’s native console.
The Analytical Workflow Model
The filtering and grouping system in AWS Cost Explorer follows a structured analytical pattern:
- Define the time range
- Select cost metric (amortized vs unblended)
- Apply filters to narrow scope
- Group by a dimension to distribute cost
- Drill down further if needed
Each adjustment dynamically recalculates the dataset and updates both graph and table views. This interactive recalculation is what enables root-cause analysis.
Tag-Based Cost Allocation
One of the most powerful capabilities of Cost Explorer is grouping by tags. If your organization enforces tagging standards such as:
- Environment (Prod / Dev / Staging)
- Team
- Application
- Customer
- Business unit
You can group cost directly by those tags to support:
- Chargeback models
- Showback reporting
- Environment-level tracking
- Product-level profitability analysis
However, this capability depends entirely on consistent tagging hygiene. If resources are untagged or inconsistently tagged, cost visibility becomes fragmented.
Savings Plans and Reserved Instance Reporting in AWS Cost Explorer
While AWS Budgets can monitor thresholds for utilization and coverage, Cost Explorer allows you to investigate how commitments are affecting effective pricing, discount realization, and overall cost structure.
This makes Cost Explorer central to commitment visibility within AWS Cost Management.
Source: AWS Amazon
Commitment Utilization Reporting
AWS Cost Explorer provides detailed reporting for both Savings Plans utilization and Reserved Instance utilization.
In Cost Explorer, you can view:
- Hourly commitment usage
- Total committed spend
- Effective utilization percentage
- Historical utilization trends
This allows teams to analyze whether commitments are:
- Consistently utilized
- Periodically underutilized
- Misaligned with workload patterns
Unlike AWS Budgets, which simply alerts when utilization drops below a threshold, Cost Explorer allows you to:
- View utilization trends over time
- Break down underutilization by account or service
- Identify which workloads are no longer matching commitment attributes
This supports root-cause investigation.
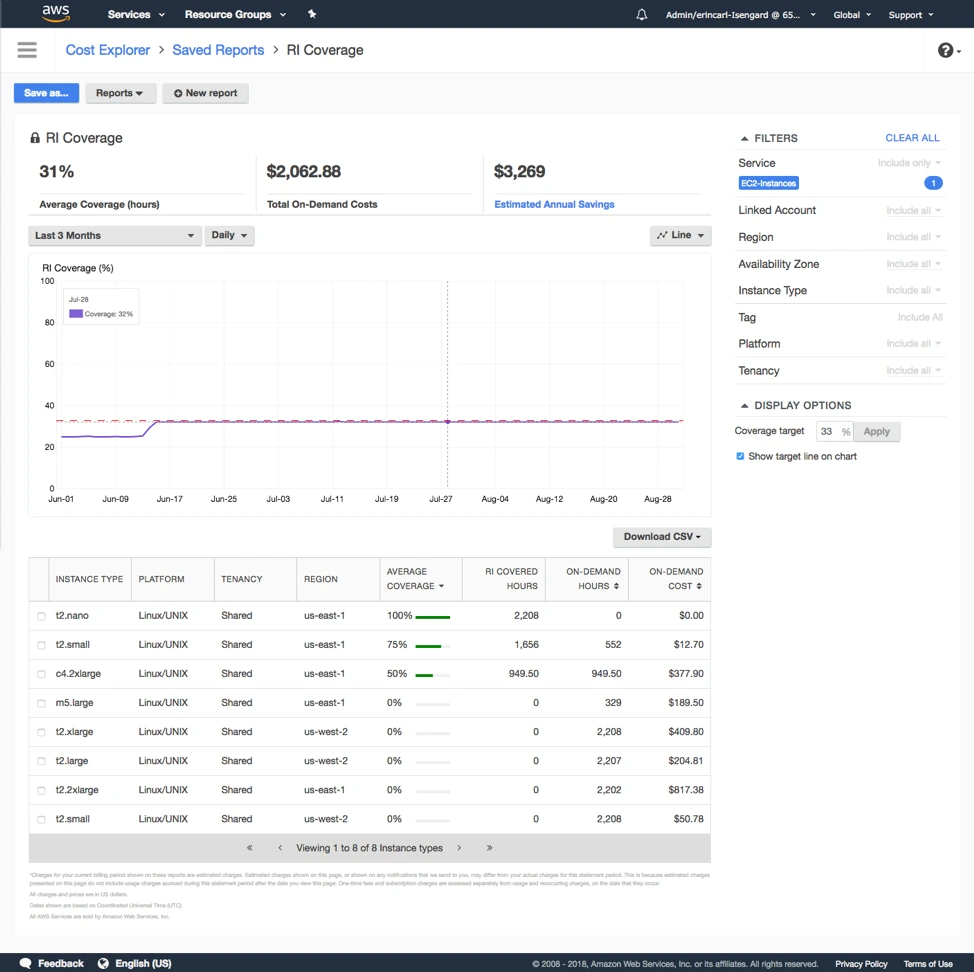
Commitment Coverage Reporting
Cost Explorer also provides detailed reporting for commitment coverage. In the Cost Explorer reporting interface, you can:
- View total eligible usage
- View portion covered by commitments
- View uncovered on-demand exposure
- Analyze coverage trends over time
This helps teams evaluate:
- How much spend remains at on-demand pricing
- Whether additional commitments might increase discount capture
- Whether workload growth is outpacing commitment strategy
Coverage reporting is particularly important for:
- Organizations scaling rapidly
- Teams adopting new instance families
- Businesses expanding into new regions
Again, Cost Explorer provides analytical visibility, not automated adjustment.
Amortized Cost and Effective Savings Analysis
One of the most important analytical tools in Cost Explorer is the ability to toggle between Unblended cost and Amortized cost.
Amortized cost spreads upfront commitment purchases across the period they apply to. This provides a more accurate view of effective pricing.
For example:
- A large Reserved Instance purchase in one month may spike unblended cost.
- In amortized view, that upfront payment is distributed across the commitment term.
This allows analysts to evaluate:
- True realized discount rates
- Effective unit economics
- Commitment ROI over time
This level of financial normalization is essential for mature FinOps analysis.
Purchase Option Grouping
Cost Explorer also allows grouping by purchase option:
- On-Demand
- Reserved Instance
- Savings Plan
This makes it possible to analyze:
- On-demand exposure
- Commitment adoption rate
- Cost distribution across pricing models
For example, you can filter to EC2 only and group by purchase option to see what percentage of EC2 spend remains on-demand versus discounted. This provides visibility into pricing efficiency across services.
Also read: A Practical Guide to AWS Savings Plans vs Reserved Instances
What Cost Explorer Does Not Do
Despite strong reporting capabilities, AWS Cost Explorer does not:
- Recommend commitment quantities
- Automatically purchase Savings Plans or RIs
- Simulate optimized coverage scenarios
- Model risk-adjusted commitment sizing
- Provide cashback or insurance mechanisms
Why This Matters in the AWS Budgets vs Cost Explorer Context
AWS Budgets can alert when utilization or coverage drops below a defined threshold. AWS Cost Explorer, on the other hand allows you to analyze why it dropped and where the mismatch occurred.
Understanding this difference is essential for organizations trying to move from basic monitoring to structured cloud cost optimization.
Forecasting in AWS Cost Explorer
AWS Cost Explorer includes a built-in forecasting feature that projects future cloud spend based on historical usage patterns.
Unlike AWS Budgets, which uses forecasting to trigger alerts, Cost Explorer uses forecasting as an analytical projection tool embedded within the reporting interface.
Its purpose is to estimate where spending is likely to land if current trends continue.
How Forecasting Works in Cost Explorer
When you enable forecasting in Cost Explorer, AWS analyzes historical cost data within the selected time range and applies trend-based statistical modeling to project future spend.
The forecast:
- Is generated automatically within the cost graph
- Extends up to 12 months into the future
- Updates daily as new billing data is processed
- Reflects the selected cost metric (unblended, amortized, or net)
The model assumes:
- Current growth trends continue
- Usage behavior remains consistent
- No major architectural changes occur
Note that it is fundamentally a historical smoothing projection, and not predictive AI.
What Forecasting Can Help You Identify
Forecasting in Cost Explorer is useful for:
- Predicting end-of-month spend mid-cycle
- Estimating year-end cloud cost trajectory
- Detecting accelerating cost growth
- Evaluating whether current spending trends are sustainable
For example, if you are halfway through the month and Cost Explorer projects a 22% increase over the prior month, that signals a structural cost shift even before the invoice closes.
Forecast vs Actual Overlay
In the Cost Explorer interface, forecasted cost appears as a projected extension of the historical cost graph.
You can visually compare Historical actual spend vs Projected future spend. This overlay helps teams determine:
- Whether growth is linear or accelerating
- Whether seasonality patterns exist
- Whether commitment adoption altered effective cost trends
The forecast automatically recalculates as new billing data arrives.
Limitations of Cost Explorer Forecasting
It is critical to understand what the forecast does not do. AWS Cost Explorer forecasting:
- Does not simulate planned infrastructure changes
- Does not model upcoming Savings Plan or RI purchases
- Does not incorporate engineering roadmaps
- Does not predict sudden scaling events
- Does not optimize commitment strategy
If a team plans to deploy a new service next month, the forecast will not anticipate that cost increase. Similarly, if workloads suddenly scale down, projections may temporarily overestimate spend.
AWS Budgets vs Cost Explorer: Side-by-Side Comparison
Below is a structured comparison across the most important functional dimensions between AWS Budgets and Cost Explorer.
Which One Should You Use and When?
Use AWS Budgets, if your goal is to:
- Set spending guardrails
- Get notified before overspending
- Monitor commitment utilization thresholds
- Enforce governance controls
Use AWS Cost Explorer, if your goal is to:
- Understand cost drivers
- Break down spend by service or tag
- Investigate sudden cost increases
- Analyze Savings Plans and RI performance
- Evaluate amortized vs unblended cost
Most organizations, however use both tools together: Budgets for proactive monitoring, and Cost Explorer for reactive investigation.
Take Control of Your Cloud Commitment Strategy With Usage AI
Monitoring costs with AWS Budgets and analyzing spend in Cost Explorer are important first steps. But visibility alone does not optimize your cloud bill.
True cloud cost optimization happens when you increase commitment coverage safely, purchase the right discount instruments at the right time, and eliminate underutilization risk.
That’s where Usage.ai comes in.
Usage.ai is an advanced cloud commitment automation and cashback-protection savings platform built for AWS, Azure, and Google Cloud. It continuously analyzes your billing and usage data, generates refreshed recommendations every 24 hours, and automates commitment purchases to maximize realized savings.
Unlike traditional optimization approaches, Usage.ai aligns incentives with your savings:
- No upfront software fees
- Fees are charged only on realized savings
- Recommendations refresh daily (not weekly)
- Commitment performance is continuously monitored
Most importantly, Usage.ai reduces commitment risk through cashback protection. If your Savings Plans or Reserved Instances become underutilized, Usage.ai pays real cash back according to your agreement. This allows teams to increase coverage confidently without fearing long-term lock-in risk.
Usage.ai also offers Flex Commitments, providing Savings Plan-like discounts without full-term rigidity, helping organizations capture savings while maintaining flexibility.
If you want to move beyond monitoring and into automated, assured savings optimization, schedule a complimentary Savings Test with Usage.ai today.
Frequently Asked Questions (FAQ)
1. What is the main difference between AWS Budgets and Cost Explorer?
The main difference between AWS Budgets and Cost Explorer is that AWS Budgets monitors predefined spending or utilization thresholds and sends alerts, while AWS Cost Explorer provides detailed cost analysis and reporting. Budgets acts as a guardrail, and Cost Explorer acts as an investigative tool.
2. Can AWS Cost Explorer send alerts?
No, AWS Cost Explorer does not provide native threshold-based alerting. It is designed for cost analysis and reporting. If you need automatic notifications when spending exceeds a limit, you must use AWS Budgets.
3. Does AWS Budgets prevent overspending?
AWS Budgets does not directly prevent overspending. It alerts you when spending or utilization exceeds defined thresholds. However, if configured with Budget Actions, it can apply IAM policy restrictions to limit certain activities once thresholds are breached.
4. Is AWS Budgets free?
AWS Budgets includes a limited number of free budgets per account, after which additional budgets may incur a small monthly charge. Pricing depends on the number and type of budgets created.
5. What cost metrics are available in AWS Cost Explorer?
AWS Cost Explorer allows you to analyze Unblended Cost, Amortized Cost, and Net Unblended Cost. Amortized Cost is often preferred for evaluating Savings Plans and Reserved Instance performance because it spreads upfront commitment payments over time.
6. What is the difference between utilization and coverage in AWS?
Utilization measures how efficiently purchased commitments (Savings Plans or Reserved Instances) are being used. Coverage measures what percentage of eligible compute usage is protected by commitments. High utilization ensures efficiency, while high coverage ensures pricing protection.
7. Which tool is better for startups: AWS Budgets or Cost Explorer?
Startups typically benefit from using both. AWS Budgets helps control monthly burn rate through alerts, while AWS Cost Explorer helps analyze cost drivers and identify which services or environments are scaling.
8. How accurate is AWS Cost Explorer forecasting?
AWS Cost Explorer forecasting is based on historical spending trends and updates daily. It assumes usage patterns continue consistently and does not predict infrastructure changes or simulate future commitment purchases.
9. Should I use both AWS Budgets and Cost Explorer?
Yes. Most organizations use AWS Budgets for proactive monitoring and AWS Cost Explorer for reactive investigation. Together, they provide guardrails and visibility across cloud spending.
10. Do AWS Budgets or Cost Explorer optimize Savings Plans automatically?
No. Neither AWS Budgets nor AWS Cost Explorer automatically purchase or optimize Savings Plans or Reserved Instances. They provide monitoring and reporting capabilities, but commitment strategy decisions remain manual.