.png)


Cloud cost forecasting is essential for organizations operating in modern cloud environments because it directly influences financial planning. In many technology-driven companies, cloud infrastructure represents 20–40% of total operating expenses. For digital-native businesses, that figure can exceed 60% of infrastructure spend. Even a 10% forecasting variance can translate into hundreds of thousands or even millions of dollars in unexpected quarterly expenses.
Despite this volatility, many organizations still rely on forecasting methods built on historical averages and linear growth assumptions, like projecting a steady 5–8% month-over-month increase based on trailing data.
However, when it comes to dynamic cloud environments, that assumption rarely holds. Even with a small deviation, companies can experience compounding forecast drift. For example, a projected $500,000 monthly spend can become $575,000 or $620,000 not because of pricing errors, but because the system evolved faster than the model.
What Is Cloud Cost Forecasting?
Cloud cost forecasting is the process of predicting future cloud expenditures using historical usage data, pricing structures, and anticipated workload changes. Its purpose is to provide financial predictability in an environment where infrastructure consumption is variable, usage-based, and continuously evolving.
At its core, forecasting attempts to answer a simple question – What will we spend next month, next quarter, or next year? In practice, the answer is far more complex.
Most organizations rely on a combination of the following approaches:
1. Historical Trend Extrapolation
This method projects future spend based on trailing averages, like assuming a steady 6–10% month-over-month increase if that pattern has held over the previous six months.
2. Budget-Based Forecasting
Finance teams begin with an annual budget target and distribute expected cloud spend across months, adjusting periodically based on variance.
3. Driver-Based Modeling
Spend is tied to business metrics such as active users, transactions, or revenue. For instance, if compute costs scale proportionally with user growth, forecasts may assume a linear relationship between the two.
4. Native Cloud Provider Forecasting Tools
AWS, Azure, and GCP provide built-in forecasting dashboards that project up to 12 months of expected spend using time-series trend analysis based on historical data.
Under relatively stable workload conditions, these methods can deliver reasonable accuracy, often within a 5–10% variance range.
Also read: Multi-Cloud Cost Optimization Guide for AWS, Azure, GCP Savings
Why Dynamic Systems Break Linear Forecasts
Traditional forecasting models are built on the idea that future behavior will resemble historical patterns within a predictable range. This assumption works in stable operating environments where infrastructure capacity and demand change gradually.
Cloud infrastructure, however, is engineered for elasticity. They scale in response to demand, often automatically and in real time. That architectural reality introduces nonlinear cost behavior.
Autoscaling and Nonlinear Compute Growth
In cloud environments, compute resources expand and contract based on utilization thresholds. A 15% increase in traffic does not necessarily produce a 15% increase in cost. It may trigger the provisioning of additional instances, database replicas, or load balancers, resulting in step-function increases in spend.
For example:
- A SaaS platform experiencing a 25% surge in user traffic during a product launch may see compute costs rise 40–60% during that billing period due to autoscaling policies.
- Short-lived demand spikes lasting hours can still materially affect monthly averages when multiplied across clusters and services.
Forecast models based on trailing three- or six-month averages rarely capture this burst behavior.
Kubernetes and Microservices Fragmentation
Modern architectures frequently rely on container orchestration platforms such as Kubernetes. While this improves engineering agility, it complicates cost attribution and forecasting.
Clusters dynamically allocate CPU and memory across dozens, sometimes hundreds of microservices. While workloads scale independently, resource requests and limits may be overprovisioned for resilience. As services deploy multiple times per week, consumption patterns shift continuously.
In such environments:
- Small configuration changes can alter cost structure materially.
- Shared infrastructure blurs cost drivers.
- Pod-level scaling introduces short-term variance that traditional forecasting models ignore.
The result is increased forecast drift, especially in fast-moving engineering organizations.
Serverless and Event-Driven Architectures
Serverless platforms further destabilize forecasting assumptions. Unlike provisioned infrastructure, serverless functions execute in response to events. Usage is transaction-based and highly variable.
For example:
- An API experiencing sporadic traffic spikes can generate unpredictable invocation volume.
- Data pipelines triggered by external integrations may vary significantly day-to-day.
- AI inference workloads can scale rapidly depending on customer demand.
Without a stable baseline, historical averages become unreliable predictors.
Rapid Feature Releases and Business Initiatives
Cloud cost volatility is not driven solely by infrastructure mechanics. Business decisions play an equally significant role.
New feature rollouts, geographic expansions, AI model deployments, or marketing campaigns can shift infrastructure consumption 20–30% within a single billing cycle. More often than not, finance teams learn of these changes only after deployment.
Also read: Why Cloud Cost Management Keeps Failing (and What Teams Are Missing)
Native Forecasting Capabilities: AWS vs Azure vs GCP
All three major cloud providers, AWS, Azure and Google Cloud Platform offer built-in cost forecasting tools designed to help customers project future spending. These tools provide valuable visibility into historical trends and near-term projections.
However, they are primarily trend-extrapolation engines and not dynamic scenario simulators. Below is a structured comparison of native forecasting capabilities across AWS, Azure, and GCP.
What This Means in Practice
Native forecasting tools are only optimized for historical visibility and budget projection.
They can:
- Extrapolate prior spend into a forward-looking estimate.
- Reflect the impact of existing commitments.
- Display projected cost ranges based on historical variance.
They do not:
- Simulate sudden traffic spikes or autoscaling bursts.
- Model probabilistic workload growth scenarios.
- Continuously recalibrate commitment timing decisions.
- Protect against underutilized commitments.
- Integrate forecasting directly with automated purchasing decisions.
In relatively stable environments, these tools may deliver forecasts within a 5–10% variance range. However, in fast-scaling SaaS companies, AI-driven workloads, or organizations deploying weekly releases, variance can exceed 15–25% during periods of rapid change.
Commitment Complexity: The Hidden Forecast Distorter
Forecasting cloud costs becomes significantly more complex once discounted commitments enter the equation. While on-demand pricing is variable and reactive, commitment instruments such as Savings Plans, Reserved Instances (RIs), and Committed Use Discounts (CUDs) introduce fixed financial obligations layered on top of elastic infrastructure.
The two models, elastic consumption and fixed commitments operate under fundamentally different assumptions. When combined, they introduce structural forecasting distortion.
On-Demand vs. Commitment-Based Pricing
On-demand cloud pricing is consumption-based. Here costs increase or decrease proportionally with usage. If compute demand falls by 20%, spend generally declines accordingly.
Commitment-based pricing, on the other hand functions differently. Organizations commit to a predefined level of usage for one to three years in exchange for discounts that can range from 20% to 66% depending on service and term length.
While this reduces unit cost, it introduces financial rigidity. Once a commitment is purchased, the obligation persists regardless of actual usage.
For example:
- A company committing to $300,000 annually in discounted compute capacity locks in approximately $25,000 per month of fixed obligation.
- If usage drops unexpectedly by 30%, that committed spend does not decline proportionally.
- If usage increases beyond coverage levels, excess demand reverts to higher on-demand pricing.
This asymmetry creates forecast sensitivity.
Coverage Ratio and Forecast Variance
Commitment coverage ratio (the percentage of total usage covered by discounted commitments) directly influences forecast stability.
Let us consider two scenarios:
Scenario A: 70% coverage
- Stable workloads
- 8% projected growth
- Forecast variance: ±5–8%
Scenario B: 70% coverage with 20% unexpected contraction
- Underutilization of commitments
- Effective savings decline
- Realized spend deviates materially from projection
Even small shifts in workload patterns can alter effective blended rates. A forecast assuming 70% coverage may implicitly assume full utilization. If actual utilization drops to 55%, effective discounting decreases, and invoice totals rise relative to forecast assumptions.
The error compounds over time if coverage assumptions are not continuously recalibrated.
Timing Risk and Recommendation Lag
Forecast distortion also occurs when commitment purchases are mistimed.
If commitments are purchased too early:
- Usage growth may not materialize.
- Underutilization risk increases.
If commitments are purchased too late:
- Excess on-demand usage erodes projected savings.
- Forecasts overestimate discount realization.
Native recommendation engines typically update on multi-day cadences. In fast-scaling environments where workloads can shift materially within weeks, even short recommendation lag introduces structural variance.
Forecasting, therefore, becomes dependent not only on usage prediction but also on optimal commitment timing and coverage calibration.
Also read: How to Choose Between 1-Year and 3-Year AWS Commitments
Why Traditional Forecasting Models Fail in Dynamic Cloud Environments
Cloud cost forecasting often relies on time-series and trend-based statistical models. While these models are mathematically sound, they are built on assumptions that do not consistently hold in elastic infrastructure systems.
To understand why forecasts break, we need to examine those assumptions.
The Assumption of Stationarity
Most forecasting methods, whether simple moving averages or more advanced time-series techniques assume a degree of stationarity. In statistical terms, stationarity means that the underlying data-generating process remains relatively stable over time. Variance, seasonality, and growth trends are expected to evolve gradually.
Traditional infrastructure environments approximated this behavior. But, cloud environments behave differently.
- Infrastructure can scale up or down within minutes.
- Engineering teams may deploy changes daily or weekly.
- Services may keep migrating between instance families, regions, or architectures.
- Pricing models may evolve.
- AI workloads may introduce new cost structures.
When the underlying system changes faster than the model adapts, stationarity assumptions collapse.
Forecast Drift and Structural Breaks
Forecast drift occurs when small deviations between projected and actual spend compound over time. It is often mistaken for random variance, but in dynamic systems, it frequently reflects structural change.
Examples of structural breaks in cloud environments include:
- Migration from on-demand to Savings Plans or CUDs
- Introduction of autoscaling policies
- Refactoring monolithic workloads into microservices
- Expansion into new geographic regions
- Adoption of GPU-based AI infrastructure
Each of these shifts alters cost behavior. A model trained on six months of prior data may no longer reflect the current operating state.
Consider a company forecasting 10% quarter-over-quarter growth based on historical expansion. If the organization simultaneously increases commitment coverage from 40% to 75%, the effective blended rate changes. Forecast assumptions tied to prior blended cost structures become invalid.
Error Metrics Most Teams Do Not Track
Many organizations evaluate forecasting accuracy only once per month by comparing projected spend to the invoice total. This binary comparison provides limited insight into model health.
More rigorous forecasting disciplines track metrics such as:
- MAPE (Mean Absolute Percentage Error) – measures average forecast deviation as a percentage of actual spend.
- RMSE (Root Mean Square Error) – emphasizes larger deviations.
- Forecast Bias – identifies systematic over- or under-estimation.
- Confidence Intervals – quantifies uncertainty bands rather than presenting a single deterministic number.
In volatile cloud environments, error bands can widen from ±5% in stable periods to ±20% or more during scaling events or architectural transitions.
Without continuous monitoring of forecast accuracy and bias, organizations mistake structural forecasting failure for routine variability.
Real-World Scenario: When Forecasting Breaks
To understand how cloud cost forecasting fails in practice, consider a mid-sized SaaS company operating across AWS with a monthly infrastructure spend of approximately $500,000.
Let’s assume the following baseline conditions:
- 60% of compute usage is covered by Savings Plans
- Remaining 40% is running on on-demand pricing
- Historical growth rate is 8% month-over-month
- Forecast model is based on trailing six-month average
- Projected spend for next month is $540,000
Under stable conditions, this forecast may appear reasonable. But then, there are two common events that can occur.
Scenario A: Unexpected Growth Spike
The company launches a new feature supported by a marketing campaign. They witness a spike in user traffic by 30% over a two-week period.
Autoscaling policies will respond automatically:
- Compute instances will increase across multiple clusters
- Database read replicas will scale
- Background processing jobs will increase
But, here’s how the actual impact will look like:
- On-demand usage will increase disproportionately
- Commitment coverage will drop from 60% to 48%
- Blended effective rate will increase
Instead of $540,000, the invoice arrives at $620,000, leading to a sharp 15% deviation from forecast.
Scenario B: Demand Contraction
In a different quarter, let’s assume that the usage declined by 20% due to customer churn or seasonal slowdown.
Compute demand falls. However:
- The company still holds fixed-term commitments.
- Commitment utilization drops from 95% to 70%.
- Effective discount realization decreases.
Projected spend was $500,000. Actual spend comes in at $560,000 due to underutilized commitments reducing effective savings.
The forecast assumed full commitment utilization. The financial obligation remained fixed even as usage declined.
Compounding Effects Over Time
If either of these scenarios repeats over several months, forecast drift still compounds:
- Budget planning becomes unreliable.
- Finance introduces conservative buffers.
- Engineering loses confidence in cost projections.
- CFO-level reporting reflects volatility rather than control.
Over a fiscal year, even a consistent 10–15% forecasting error on a $6 million annual cloud budget represents $600,000–$900,000 in variance.
Also read: Cloud Cost Analysis: How to Measure, Reduce, and Optimize Spend
Why Usage.ai Is Built for Dynamic Cloud Cost Forecasting
When dynamic infrastructure breaks static forecasting models, the solution is a different architectural approach to cost management that treats forecasting as a continuous control system.
Usage.ai was built specifically to solve this structural mismatch. It is a commitment automation and cashback-assured savings platform designed to operate in elastic, high-variance cloud environments across AWS, Azure, and GCP.
Where native tools extrapolate historical trends, Usage.ai continuously recalibrates commitment coverage and purchasing decisions in real time.
24-Hour Recalibrated Commitment Recommendations
While dynamic systems require short feedback loops, Usage AI refreshes commitment recommendations every 24 hours. This reduces forecast drift caused by lag between workload changes and financial action.
Instead of:
- Reviewing savings monthly
- Manually analyzing coverage gaps
- Purchasing commitments reactively
Organizations operate on a continuous optimization loop:
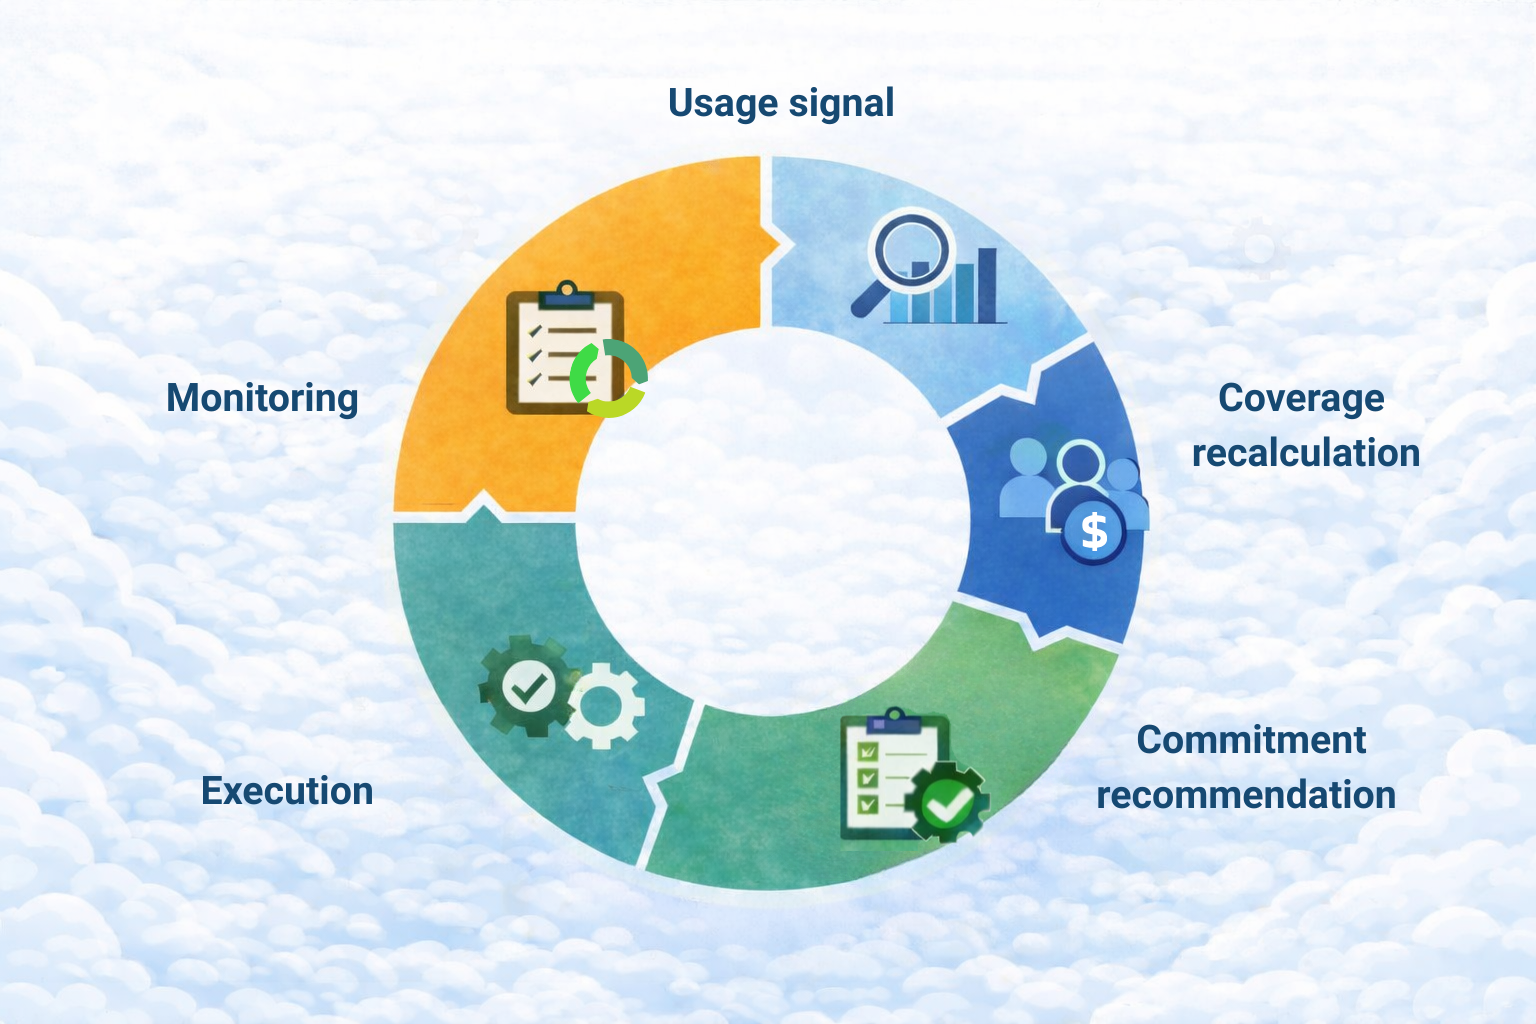
Usage signal → Coverage recalculation → Commitment recommendation → Execution → Monitoring
Flex Commitments: Unlocking Discounts Without Full Lock-In
One of the largest sources of forecast instability is long-term commitment rigidity. Traditional Savings Plans and Reserved Instances require 1–3 year lock-ins. While discounts can reach 20–66%, underutilization risk introduces financial anxiety.
Usage.ai’s Flex Commitments are designed to provide Savings Plan–like discounts while reducing long-term lock-in risk. This changes forecasting behavior materially.
Finance teams can:
- Increase commitment coverage more confidently
- Reduce exposure to underutilization
- Capture deeper blended rate reductions
Cashback Protection: Real Money When Usage Drops
If usage drops 20–30%, traditional commitments remain fixed obligations. Effective savings decline. Usage.ai mitigates this risk through cashback protection.
If commitments are underutilized, customers receive real cash back (not platform credits) according to agreed terms. This protects against downside exposure and reduces the financial penalty of forecast error.
The structural impact is significant:
- Higher coverage becomes financially safer.
- Forecast variance narrows.
- Finance teams gain confidence to optimize aggressively rather than conservatively.
Fees Only on Realized Savings
Usage.ai aligns incentives structurally with customer outcomes. The platform charges a percentage of realized savings, meaning it only gets paid when customers save money. There are no flat SaaS licensing fees detached from performance.
This model ensures:
- Continuous optimization focus
- Alignment between forecast accuracy and savings execution
- Reduced friction in procurement decisions
For organizations spending $5M–$50M annually in cloud infrastructure, even a 10% improvement in effective commitment coverage can translate into hundreds of thousands or millions in annual savings.
Forecasting as a Financial Control System
Usage.ai reframes forecasting as a continuously managed system rather than a point-in-time estimate. Instead of asking, “What will we spend?” the platform continuously evaluates:
- Current workload behavior
- Commitment coverage ratios
- Underutilization risk exposure
- Growth and contraction signals
- Blended effective rates
These inputs feed into automated commitment optimization and cashback risk mitigation mechanisms that operate on a 24-hour recalibration cycle.
The result is structural stabilization.
- When commitment coverage adjusts dynamically to workload shifts, forecast variance narrows.
- When underutilization risk is protected through cashback mechanisms, financial downside exposure decreases.
- When recommendations are refreshed daily rather than weekly, lag-driven drift is reduced before it compounds.
Forecasting, in this model, becomes an integrated control loop that connects usage signals, commitment execution, and risk protection into a single operating framework. Usage.ai is engineered to provide that control.
Book a demo or sign up for free to discover how Usage.ai can automate commitment optimization and protect your cloud savings.