.png)

Savings Plan amortized cost in AWS Cost Explorer is the mechanism that converts a front-loaded or recurring Savings Plan fee into a daily rate you can actually reason about. The default unblended view shows what AWS billed your account on each day, which means a 1-year All Upfront Savings Plan appears as a single large charge on Day 1, then silence for 364 days. That's accurate from a cash-flow perspective, but it's operationally useless for FinOps teams trying to track commitment ROI across accounts, allocate costs to teams, or detect underutilization.
This post covers what amortized cost is technically, how it differs from unblended and blended, how to access it in Cost Explorer, what the numbers actually mean in a worked example, and critically how to use the amortized view to identify unused Savings Plan commitment before it compounds into significant waste.
Amortized cost is a cost dataset in AWS Cost Explorer and the Cost and Usage Report (CUR) that spreads Savings Plan fees uniformly across each day of the commitment term. It reflects an accrual accounting view of your cloud spend.
The formula AWS applies:
Daily Amortized Fee = (Total Plan Fee) ÷ (Total Days in Term)
For a 1-year No Upfront Compute Savings Plan at $10/hour ($87,600/year):
For a 1-year All Upfront plan at $80,000 upfront:
The effective cost per covered compute-hour you see in Cost Explorer's amortized view is the true discounted rate which is the number your finance team should be using for chargebacks and the number you should be monitoring to verify your Savings Plan is performing as expected.
(Verify current Savings Plan rates at Amazon Pricing as rates changes)

This is a question that generates the most confusion in cost allocation discussions. Here's the precise distinction:
The key operational difference between unblended and amortized:
An unblended view tells you what happened to your AWS bill. An amortized view tells you whether your Savings Plan is working. These are different questions.
If you buy a 1-year All Upfront Compute Savings Plan and look at unblended cost, you'll see $80,000 on Day 1 and near-zero Savings Plan line items for the rest of the year. If your usage drops 40% in Month 6, nothing in the unblended view tells you that the $80,000 is already spent.
In the amortized view, Month 6 shows you unused commitment cost as a daily line item. That's the waste signal.
Also read: On-Demand vs Reserved vs Spot Instances: The Complete AWS Pricing Guide
The prerequisites include:
Step 1: Open Cost Explorer
Navigate to the AWS Console → Billing and Cost Management → Cost Explorer. Alternatively, direct URL: console.aws.amazon.com/cost-management/home#/cost-explorer
.png)
Step 2: Set your date range
Select a date range that covers your Savings Plan's active period. For utilization analysis, a minimum 30-day window gives you enough data to see patterns. For a new plan, even 7 days shows you whether coverage is applying.
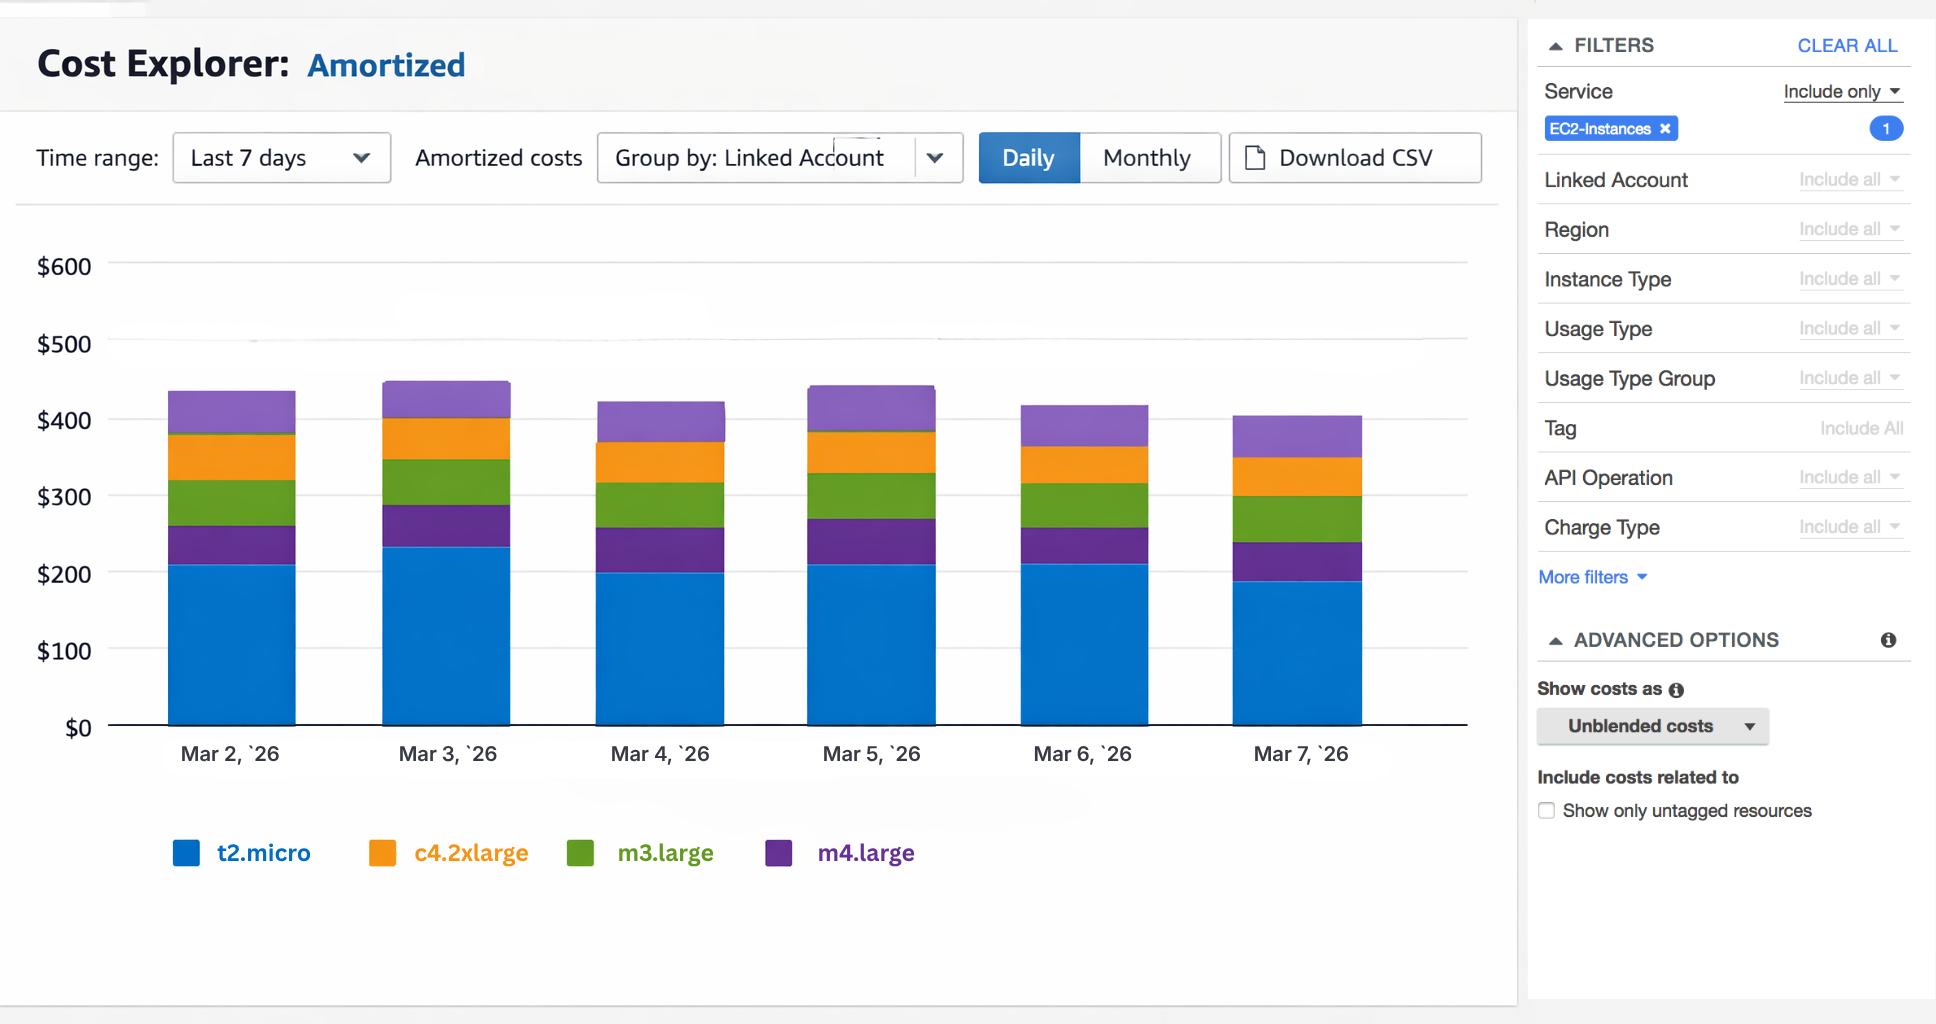
Step 3: Open Advanced Options
In the right-hand panel, scroll to Advanced Options. You will see a cost type selector defaulting to Unblended costs.
Step 4: Select "Amortized costs"
Click the dropdown and select Amortized costs. The chart updates immediately. If you have upfront Savings Plans, you'll see the previously lumpy daily cost line flatten into a consistent daily rate.
Step 5: Group by dimension
To see which services or accounts are benefiting from your Savings Plan:
Step 6: Identify the "Savings Plans recurring fee" and "Savings Plans upfront fee" line items
In the amortized view, AWS breaks Savings Plan cost into two components:
When your usage fully covers the commitment, these line items appear as negative offsets against your on-demand charge, netting to the discounted rate. When your usage doesn't cover the commitment, the unused portion appears as a positive cost with no offsetting savings. That positive line item is your waste.
The amortized view doesn't just show you savings, it also shows you failures.
Here’s an worked example. Let’s assume you purchase a Compute Savings Plan committing to $5/hour ($43,800/year at 1-year No Upfront pricing).
On a day where your qualifying compute usage is:
In the unblended view, none of this is visible as a daily signal. The SP fee was either charged upfront or billed monthly. In the amortized view, unused commitment appears as a real-time daily cost line.

Why this matters at scale:
A 30% underutilized Compute Savings Plan on a $500,000/year commitment generates $150,000/year in unused commitment cost. This is the spent that produces zero AWS resources. At $6–12K/day in potential commitment waste for larger environments, a single underutilization event that goes undetected for 30 days is a $180K–$360K problem.
Also read: AWS Budgets vs Cost Explorer: Key Differences Explained
In an AWS Organization, Savings Plans purchased in a management account (or a delegated purchasing account) can apply across all linked accounts. The amortized view is the only Cost Explorer dataset that properly attributes this coverage.
How attribution works:
Why this matters for showback and chargeback
If your organization has 15 linked accounts and you're running showback reports, the unblended view will show the purchasing account bearing the full Savings Plan cost. The amortized view distributes that cost to the accounts that actually consumed the coverage. For any accurate internal cost allocation, you must use amortized cost as unblended will systematically overcharge the management account and undercharge linked accounts.
For FinOps engineers querying the CUR directly (Athena, Redshift, or a third-party tool), amortized cost lives in specific fields:
Sample Athena query to surface unused commitment by day:
SELECT
  line_item_usage_start_date AS usage_date,
  savings_plan_savings_plan_a_r_n AS plan_arn,
  SUM(savings_plan_unused_commitment) AS daily_unused_commitment,
  SUM(savings_plan_used_commitment) AS daily_used_commitment,
  ROUND(
    SUM(savings_plan_unused_commitment) /
    NULLIF(SUM(savings_plan_used_commitment + savings_plan_unused_commitment), 0) * 100, 2
  ) AS unused_pct
FROM your_cur_table
WHERE line_item_line_item_type = 'SavingsPlanNegation'
  OR line_item_line_item_type = 'SavingsPlanCoveredUsage'
  OR line_item_line_item_type = 'SavingsPlanRecurringFee'
  OR line_item_line_item_type = 'SavingsPlanUpfrontFee'
GROUP BY 1, 2
ORDER BY 1 DESC, 3 DESC;
(Verify CUR field names against your specific CUR configuration at amazon docs. Field availability depends on CUR version and configuration.)
AWS Cost Explorer labels its datasets as "Amortized" and "Actual" (which is their UI term for unblended) in some views, and as "Amortized" and "Unblended" in others. These are the same distinction presented with different labels depending on which Cost Explorer view you're in.
Savings Plans Utilization Report: Uses actual (unblended) cost and shows what you paid. The utilization % here is based on the committed $/hour vs. applied $/hour.
Savings Plans Coverage Report: Uses on-demand equivalent cost to calculate coverage % and does not use amortized cost directly.
Cost Explorer main chart (Explore Costs): Defaults to unblended. Switch to amortized in Advanced Options.
CUR: Contains both. Use lineItem/UnblendedCost for cash-basis or savingsPlan/SavingsPlanEffectiveCost for amortized. Never mix these in the same query.
The most common mistake in FinOps dashboards is summing lineItem/UnblendedCost and savingsPlan/SavingsPlanEffectiveCost in the same aggregation. The result is double-counting. Choose one methodology and apply it consistently across every report.
Also Read: AWS Savings Plan Buying Strategy: Layering, Timing & Right-Sizing Commitment
Amortized cost is necessary for commitment analysis but not sufficient for commitment management. Here's where the view breaks down operationally:
Limitation 1: Latency AWS Cost Explorer data has a 24–72 hour refresh latency for standard cost data. Savings Plans utilization data in Cost Explorer can lag by up to 3 days. For a team running daily commitment health checks, you may be looking at utilization data that's already 3 days stale. At $6–12K/day in potential waste for a mid-sized AWS environment, a 72-hour refresh cycle means a utilization problem can compound to $18K–$36K before it appears in your dashboard.
Limitation 2: No forward-looking recommendations The amortized view shows you historical commitment performance. It cannot tell you whether your current usage trajectory will outpace or undershoot your commitment for the rest of the month. That requires separate modeling against current usage patterns.
Limitation 3: No automated action Cost Explorer shows you the problem i.e., unused commitment appearing as a daily cost line. But fixing that problem (adjusting commitment size, redistributing coverage, or capturing cashback on unused commitments) requires a separate workflow. The view is diagnostic, not prescriptive.
The gap between "amortized cost shows me unused commitment" and "I can act on unused commitment" is where automated commitment management platforms operate.
The core problem is most teams review Savings Plans utilization monthly or quarterly. AWS Cost Explorer's recommendation engine refreshes every 72+ hours. By the time a utilization drop appears in Cost Explorer, is reviewed in a weekly FinOps meeting, and reaches a decision about adjusting commitment sizing, 2–4 weeks of unused commitment may have accumulated.
What automation changes
AWS Cost Explorer refreshes commitment data every 72+ hours. Usage.ai refreshes every 24 hours. That 48-hour gap has a dollar value: at a $500K/year Savings Plan with 20% underutilization, you're burning roughly $274/day in unused commitment. Miss it for 3 days because your tooling is stale, that's $822 gone before anyone sees the signal.
The second problem is what happens after you catch it. Every other vendor in this space gives you credits when your commitment goes unused. Credits apply against future AWS invoices. Usage.ai gives you cash back, i.e., actual money returned, not a discount on next month's bill. Unused commitment stops being a sunk cost and becomes a recoverable one.
How it works: Usage.ai operates at the billing layer only with no infrastructure changes, or access to production resources. Setup takes 30 minutes. Recommendations are generated from daily usage pattern analysis, and commitments are sized to match actual baseline usage rather than peak which directly reduces the unused commitment visible in your amortized cost view.
For a FinOps team managing a consolidated AWS Organization with 10–30 linked accounts, the amortized view of Savings Plan unused commitment is the first diagnostic signal. The next step is automating the response to that signal and not reviewing it manually every few weeks.
See how much unused commitment you're carrying. Book a free savings assessment.
1. What is amortized cost in AWS Cost Explorer?
Amortized cost is a cost dataset in AWS Cost Explorer that spreads the total fee of a Savings Plan (upfront and recurring charges) evenly across each day of the commitment term. Instead of showing a large charge on the day you purchase an All Upfront plan, the amortized view shows a consistent daily effective rate.
2. What is the difference between actual cost and amortized cost in AWS?
Actual cost (also called unblended cost) reflects what AWS billed your account on each calendar day. It is a cash-basis view that matches your invoice. Amortized cost spreads commitment fees across the term, giving you a daily effective rate. For a No Upfront plan, the two views will be nearly identical (monthly recurring fees already appear daily). For All Upfront plans, actual cost shows the full purchase amount on Day 1; amortized cost shows 1/365th of that amount each day.
3. How do you access the amortized cost view in Cost Explorer?
In the AWS Console, navigate to Billing & Cost Management → Cost Explorer. In the right-hand panel under Advanced Options, select Amortized costs from the cost type dropdown (the default is Unblended costs). The chart updates immediately. For multi-account analysis, group by Linked Account to see how amortized Savings Plan coverage distributes across your Organization.
4. What does unused Savings Plan commitment look like in the amortized view?
In Cost Explorer's amortized view, unused Savings Plan commitment appears as a positive daily cost line labeled "Savings Plans recurring fee" (or "upfront fee") that has no offsetting covered usage. For example, if you commit to $5/hour and only use $3.50/hour of coverage, the remaining $1.50/hour shows as an unused commitment fee, roughly $36/day. This is the most direct signal that your Savings Plan is oversized for your current usage. AWS attributes unused commitment cost to the account that owns the plan, not to the linked accounts that didn't consume it.
5. Should I use amortized cost or unblended cost for chargeback and showback?
Use amortized cost for chargeback and showback in any organization that uses Savings Plans or Reserved Instances. The unblended view attributes the full plan purchase to the account that bought the commitment, which is typically the management account and shows $0 cost for linked accounts that benefit from the coverage. Nearly all major FinOps frameworks (including FOCUS, the FinOps Foundation cost allocation standard) recommend amortized cost as the baseline for commitment cost allocation.
6. What is the difference between Savings Plans and Reserved Instances in the amortized view?
Both Savings Plans and Reserved Instances produce amortized cost line items in Cost Explorer using the same spreading mechanism. The key difference is scope: Reserved Instance amortized cost appears at the instance type and region level, while Savings Plan amortized cost appears at the compute family level (Compute Savings Plans) or instance family level (EC2 Instance Savings Plans).
7. How do I calculate the effective savings rate from the amortized view?
Effective savings rate from the amortized view = (On-Demand Equivalent Cost − Amortized SP Cost) ÷ On-Demand Equivalent Cost × 100. AWS surfaces this calculation in the Savings Plans Utilization Report, but you can replicate it in Athena using CUR data: divide savingsPlan/SavingsPlanEffectiveCost by the on-demand equivalent rate for each covered line item. A Compute Savings Plan delivering a 30% effective savings rate on $1M/year of qualifying compute spend produces $300K/year in savings, but only if utilization remains near 100%. At 70% utilization, unused commitment erodes the effective rate to closer to 21%.
8. What happens to the amortized cost view when a Savings Plan expires?
When a Savings Plan reaches its end date, amortized cost line items stop. The remaining compute usage reverts to on-demand rates, which appear in the unblended and amortized views identically (no spreading needed for on-demand). In Cost Explorer, you'll see a step-change increase in daily cost on the expiry date unless a renewal or new commitment is in place.
Share this post

.svg)

.png)