.png)


Key Takeaways
|
Your RI coverage is 85% and your AWS bill is still climbing. ESR explains why coverage metrics lie to you, how to calculate the number that actually tells the truth, and what to do once you have it.
This guide covers everything a FinOps team needs to work with ESR: the formula, step-by-step calculation from AWS CUR data, Azure and GCP equivalents, industry benchmarks by spend tier, the six most common causes of low ESR, how to improve it, and the one dimension ESR still cannot measure.
What Is Effective Savings Rate (ESR)?
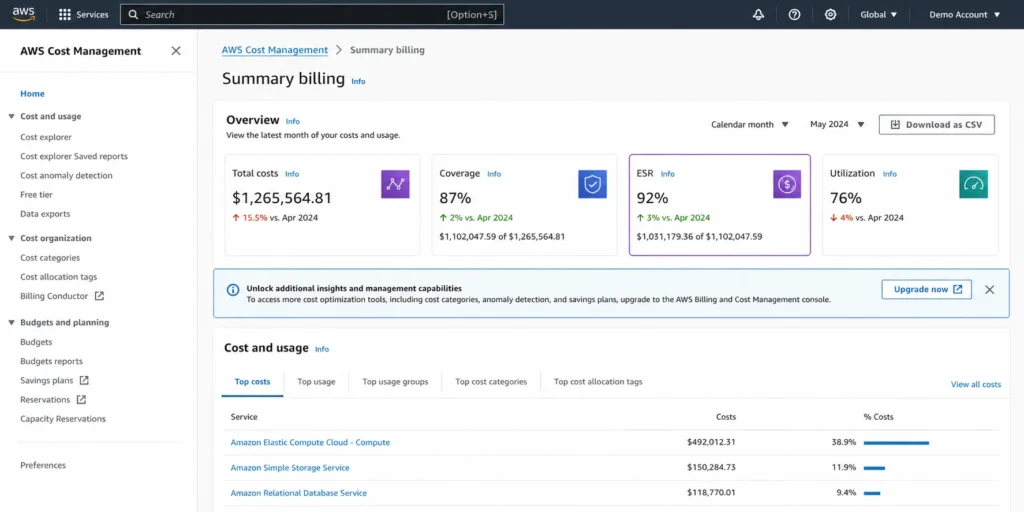
Effective Savings Rate (ESR) is a FinOps KPI that measures the true ROI of cloud discount instruments. It was introduced by ProsperOps co-founder Erik Carlin in 2019 and has since been adopted as a standard metric by the FinOps Foundation under the Rate Optimization capability. AWS embedded it natively in the Cost and Usage Dashboard’s Summary Billing tab.
Before ESR, FinOps teams tracked two proxy metrics: coverage and utilization.
- Coverage answers: what percentage of your resources have a discount instrument applied? It says nothing about whether that instrument is actually saving you money or how large the discount is.
- Utilization answers: what percentage of your purchased commitments are being consumed? It says nothing about whether you purchased the right amount or the right type.
ESR answers the real question: what is the net percentage discount you are receiving across your entire eligible cloud spend, after accounting for coverage, utilization, and discount rate simultaneously?
| Standard Definition: Effective Savings Rate (ESR)
Effective Savings Rate (ESR) is a FinOps KPI measuring the true ROI of cloud discount instruments. It expresses the aggregate percentage reduction in cloud costs from all rate optimization efforts, including Savings Plans, Reserved Instances, Committed Use Discounts, private rates, and Spot, relative to what the same workloads would cost at full on-demand pricing. Source: FinOps Foundation. |
In the FinOps discipline, ESR functions as the primary KPI for the Rate Optimization capability. It is the metric that connects the work of commitment purchasing and portfolio management directly to a financial outcome the business can measure.
A FinOps team that reports ESR monthly gives finance leadership a number that means, for example, how we reduced our cloud bill by 28% relative to what we would have paid on-demand. That translation from activity to outcome is what makes ESR the cloud commitment savings rate metric that has replaced coverage and utilization as the north-star KPI across the FinOps community.
How Is Effective Savings Rate Calculated? The Formula and What Each Term Means
There are two equivalent ways to write the ESR formula. While the FinOps Foundation uses the subtraction form, most dashboards display the division form.
| ESR Formula: Two Equivalent Forms
Form 1 (Division): ESR = 1 – (Actual Spend / On-Demand Equivalent Spend) Form 2 (Savings): ESR = Cloud Savings Generated On-Demand Equivalent (ODE) Spend Both forms are mathematically identical. Verify current on-demand rates at AWS pricing, rates change. |
What each term means in practice
On-Demand Equivalent (ODE) Spend is the theoretical cost of running your exact workloads at full on-demand pricing with zero discounts applied. This is your baseline denominator. It does not change based on what commitments you buy. It only changes when your actual resource usage changes.
Actual Spend Including Discounts is what you actually paid after all discount instruments are applied. This includes amortized upfront costs for Reserved Instances if you chose a partial or all-upfront payment option.
Cloud Savings Generated is simply ODE Spend minus Actual Spend. A $1M ODE with $700K actual spend means $300K in savings generated and a 30% ESR.
Here’s an example
An organization runs $1M per month in on-demand equivalent AWS compute. They have purchased Savings Plans covering 60% of their compute at an average 35% discount, with 95% utilization on those Savings Plans.
What their bill looks like:
| Portion of Compute | ODE Spend | After Discount | Actual Cost |
| Covered by Savings Plans (60%) | $600K | 35% off | $390K |
| Uncovered, on-demand (40%) | $400K | No discount | $400K |
| Total | $1M | $790K |
ESR = ($1M – $790K) / $1M = $210K / $1M = 21%
Now the same organization expands coverage from 60% to 85%, keeping the same discount rate and utilization. Here’s how:
| Portion of Compute | ODE Spend | After Discount | Actual Cost |
| Covered by Savings Plans (85%) | $850K | 35% off | $552K |
| Uncovered, on-demand (15%) | $150K | No discount | $150K |
| Total | $1M | $702K |
ESR = ($1M – $702K) / $1M = $298K / $1M = 29.8%
| Key Insight
ESR is multiplicative. Improving any one of the three components, coverage, utilization, or discount rate, improves your ESR. But they interact. A 90% coverage rate with 70% utilization and a 30% discount rate will underperform a 70% coverage rate with 95% utilization and a 40% discount rate. ESR captures the net outcome of all three. |
How to Calculate ESR from AWS Cost and Usage Report (CUR) Data
The AWS Cost and Usage Report (CUR) is the data source for a precise ESR calculation. The AWS native Savings Plans and RI dashboards give you an approximation. CUR gives you the exact number because you can control exactly which resources and line items are included.
Prerequisites
Before calculating ESR from CUR, confirm the following:
- CUR is enabled in your AWS account with resource-level granularity turned on.
- The report includes amortized costs (not just blended or unblended).
- You are filtering to the services you want to measure.
ESR is typically calculated for compute-eligible resources, like EC2, Fargate, Lambda, RDS, ElastiCache, Redshift, and OpenSearch.
Step-by-step calculation
Step 1: Pull Actual Spend
From your CUR, filter line items by the services you are measuring. Sum the lineItem/NetAmortizedCost field. This gives you actual spend including all amortized commitment costs and any enterprise discount program adjustments.
Step 2: Pull On-Demand Equivalent Spend
Sum the pricing/publicOnDemandCost field for the same line items and time period. This is the on-demand rate for the exact resources you ran, regardless of what discounts were applied.
Step 3: Calculate ESR.
ESR = 1 – (Net Amortized Cost / Public On-Demand Cost).
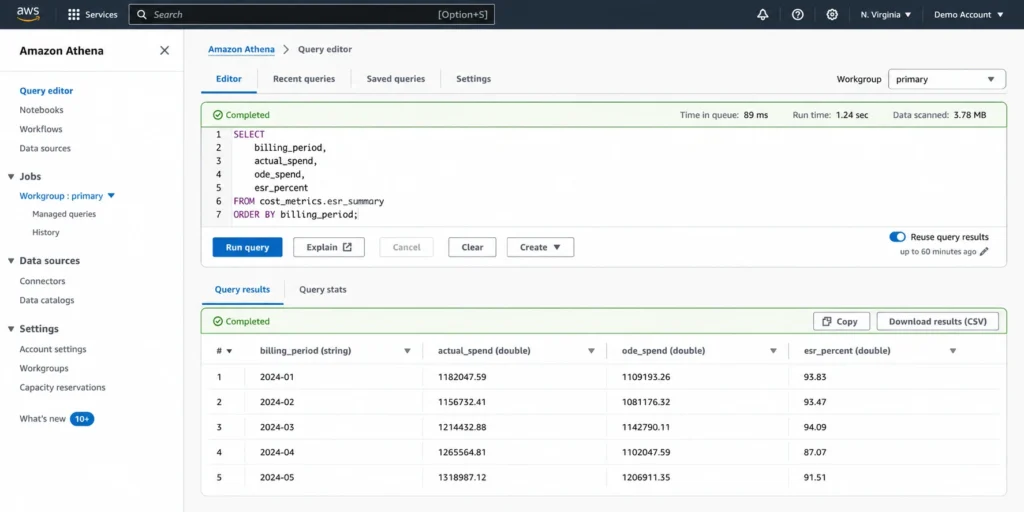
| /* Run against your CUR Athena table */
SELECT bill_billing_period_start_date AS billing_period, SUM(line_item_net_amortized_cost) AS actual_spend, SUM(pricing_public_on_demand_cost) AS ode_spend, ROUND( (1 – SUM(line_item_net_amortized_cost) / NULLIF(SUM(pricing_public_on_demand_cost), 0)) * 100, 2 ) AS esr_percent FROM your_cur_table WHERE line_item_product_code IN ( ‘AmazonEC2’, ‘AmazonRDS’, ‘AmazonElastiCache’, ‘AmazonRedshift’, ‘AWSLambda’ ) AND pricing_public_on_demand_cost > 0 GROUP BY 1 ORDER BY 1 DESC; |
Common calculation errors to avoid
- Using blended cost instead of net amortized cost. Blended cost averages rates across an organization and does not reflect actual commitment discounts accurately. Always use lineItem/NetAmortizedCost for ESR calculations.
- Including non-commitment-eligible services. Data transfer, support costs, and marketplace charges have no on-demand equivalent in the commitment sense. Including them in your denominator will artificially deflate your ESR. Filter to commitment-eligible services only.
- Forgetting upfront RI costs. If you purchased Reserved Instances with an upfront payment, those costs need to be amortized across the commitment term. lineItem/NetAmortizedCost handles this automatically. Unblended cost does not.
- Measuring the wrong time period. ESR calculated over a single day can vary dramatically due to billing timing. Always calculate ESR over a full calendar month for consistent benchmarking.
How to Calculate ESR for Azure and GCP
The ESR formula is identical across all three major cloud providers. The data sources differ. Here is where to pull the required fields for each.
Amazon Web Services
- Actual Spend: lineItem/NetAmortizedCost from CUR
- ODE Spend: pricing/publicOnDemandCost from CUR
- Commitment types: Savings Plans, Reserved Instances
- Native ESR view: Cost Management Summary Billing tab
Microsoft Azure
- Actual Spend: CostInBillingCurrency from usage detail export
- ODE Spend: PayGPrice x Quantity from the same export
- Commitment types: Azure Reservations, Azure Savings Plans
- Native ESR view: Cost Management Rate Optimization view (verify at portal.azure.com)
Google Cloud Platform
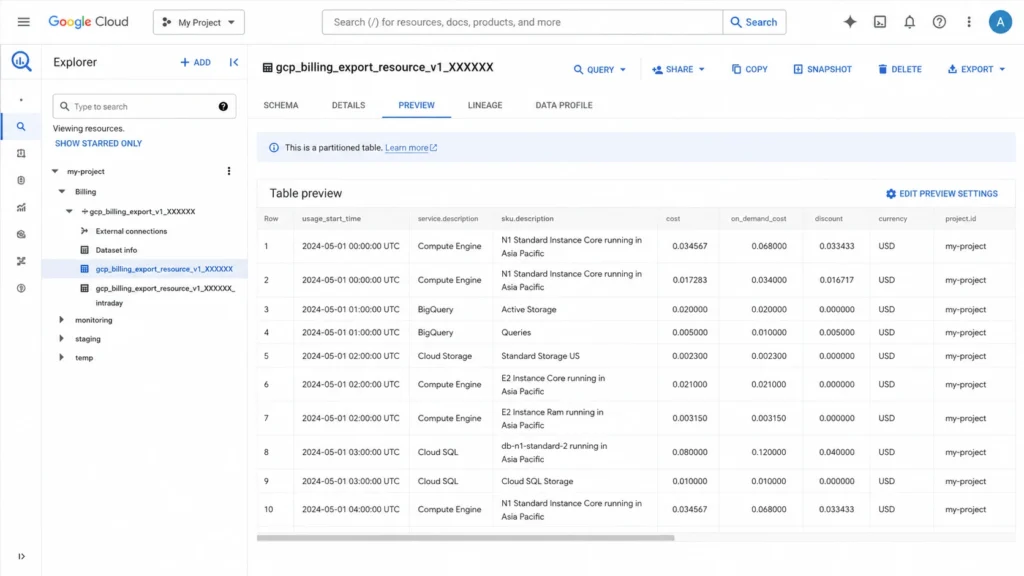
- Actual Spend: cost field in Cloud Billing BigQuery export
- ODE Spend: on_demand_cost from the same export
- Commitment types: Committed Use Discounts (CUDs)
- Native ESR view: No native ESR view as of Q1 2025. Must calculate from BigQuery.
| Azure and GCP Note
Azure’s billing export field names and GCP’s BigQuery schema change periodically. Always verify the current field names in the official documentation before building any ESR calculation pipeline. The fields listed above were accurate as of Q1 2025. Verify at learn.microsoft.com and cloud.google.com respectively. |
ESR Industry Benchmarks: What Good Actually Looks Like
ProsperOps published a 2024 benchmarking report analyzing $1.5B+ in annualized AWS compute spend across hundreds of organizations. All data was sourced from prospect accounts before they adopted ProsperOps, making it a reasonably representative view of how the market actually performs without automated optimization.
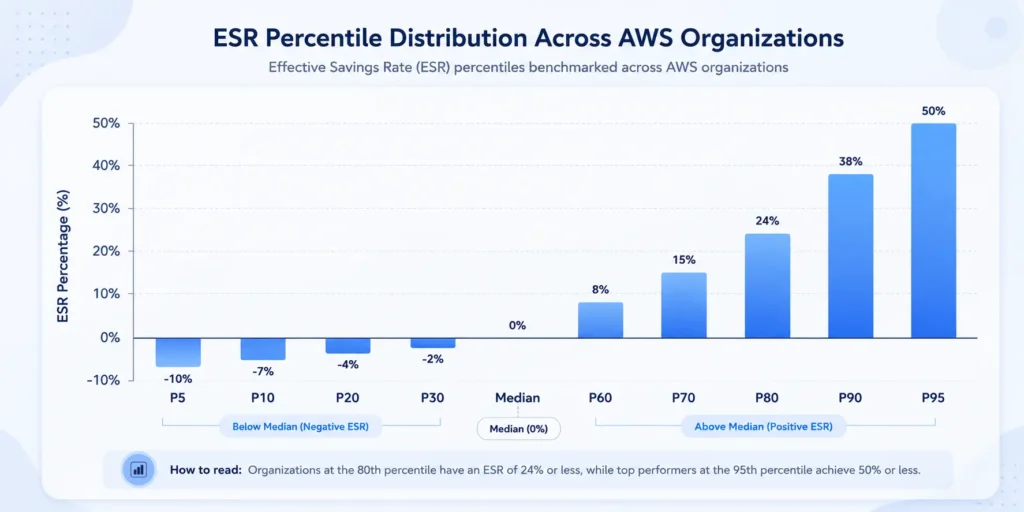
- 0%: Median ESR. Half of all organizations save nothing on compute.
- 23%: 75th percentile. Above average for active FinOps teams.
- 46%: 98th percentile. World-class. Requires sophisticated automation.
- -9%: Minimum observed. Overcommitment cost more than on-demand.
Source: ProsperOps 2024 AWS Compute ESR Benchmarking Report.
The 0% median is the most important benchmark number. It means that when you randomly sample AWS organizations, the most common ESR is zero. Half of all organizations are paying full on-demand rates for every resource they run. That is not a small opportunity: at $500K per year in compute spend, moving from 0% to a modest 25% ESR saves $125K annually without touching architecture or rightsizing.
ESR benchmarks by spend tier
| Annual Compute Spend | 75th Percentile ESR | Coverage at 75th Percentile | Savings Opportunity at 98th Percentile |
| Under $1M / year | 15% | 53% | 31pp improvement to reach world-class |
| $1M to $5M / year | 31% | 86% | 15pp improvement to reach world-class |
| Over $5M / year | 40% | 91% | 6pp improvement to reach world-class |
The dollar impact of ESR improvement
A 5 percentage point ESR improvement on $10M in annual compute spend equals $500K in annual savings. That math is Annual Savings = Annual Compute ODE Spend x ESR Improvement. At $1M spend, a 5pp improvement equals $50K. At $50M spend, the same 5pp improvement equals $2.5M annually.
Six Reasons Why Your ESR Low and How to Identify Each One
Most low-ESR organizations fall into one or more of these six patterns. Identifying which one applies to your environment is the fastest path to improvement.
1. No commitments at all
The most common cause. 53% of AWS organizations use zero Savings Plans or Reserved Instances. ESR equals 0% by definition. The fix is straightforward but requires confidence in usage forecasting.
2. Low coverage on high-spend resources
Teams often apply commitments to smaller, predictable workloads and leave the largest, most expensive resources on-demand. ESR stays low because the high-ODE resources pull down the aggregate.
3. Overcommitment and low utilization
Purchased more commitments than current usage supports. Utilization falls below 70-80%. The stranded commitment hours cost money without providing coverage benefit, pulling ESR toward negative territory.
4. Wrong instance family or region
Standard Reserved Instances are instance-family-specific. Buying m5 RIs when your workload has migrated to m6i means the RI provides no coverage. The ODE accumulates. The RI charges anyway.
5. Suboptimal commitment type selection
Choosing 1-year No Upfront Savings Plans when 3-year Partial Upfront would deliver 20+ percentage points higher discount. The coverage exists but the discount rate is low, capping ESR regardless of utilization.
6. Stale recommendations
AWS Cost Explorer refreshes commitment recommendations every 72+ hours. Usage patterns that shift within that window are not reflected in new purchase recommendations, creating coverage gaps that erode ESR
Why High Coverage Does Not Mean High ESR
This is the most common misconception in cloud cost optimization. Teams hit 85% RI coverage, present the number in a quarterly review, and then discover their AWS bill increased anyway. ESR explains what happened.
This worked example demonstrates this clearly. Compare two environments with the same $1M per month ODE spend:
| Scenario | Coverage | Utilization | Discount Rate | Monthly Savings | ESR |
| Environment A | 75% | 100% | 30% | $225K | 22.5% |
| Environment B | 100% | 55% | 30% | $165K | 16.5% |
Environment B has higher coverage. Environment A has higher ESR. The difference is utilization: Environment B bought 100% coverage but only uses 55% of the commitments it purchased. The stranded 45% is still charged, reducing the net savings.
This is exactly why the FinOps Foundation and ProsperOps both argue that ESR should replace coverage as the primary KPI for commitment performance. Coverage is a process metric. ESR is an outcome metric.
How Do You Improve Effective Savings Rate? A Practical Framework
ESR improvement follows a clear priority order. Start with the dimension that has the largest gap relative to benchmark, then work through the others.
If your coverage is below 60%: expand commitments strategically
The fastest ESR gains come from expanding coverage on high-ODE resources. Pull your CUR data and sort resources by pricing/publicOnDemandCost descending. The top 20% of resources by ODE spend typically represent 60-70% of your total ODE. Applying commitments to this group has disproportionate ESR impact.
For AWS, use Compute Savings Plans as your first commitment layer. Compute Savings Plans apply to EC2, Fargate, and Lambda across any region, instance family, and OS. They provide 66% of the maximum discount available on EC2 with maximum flexibility. Reserve EC2 Instance Savings Plans and Standard RIs for high-confidence, stable workloads where you want to capture the remaining discount delta.
If your utilization is below 80%: reduce or exchange commitments
Utilization below 80% is the signal for overcommitment. The options are: let existing commitments expire without renewal, exchange Convertible Reserved Instances for a different instance type or family that your workloads are actually running, or sell Standard Reserved Instances in the AWS Reserved Instance Marketplace to recover partial value. For Savings Plans there is no exchange mechanism, so the recovery path is cashback from a platform that offers it (covered in the next section), or absorbing the waste as a known cost until expiry.
If your discount rate is below 25%: optimize term and payment structure
Discount rates vary significantly by term (1-year vs 3-year) and payment option (No Upfront, Partial Upfront, All Upfront). For reference, AWS EC2 Compute Savings Plans deliver approximately 40% savings on a 1-year No Upfront basis and up to 66% savings on a 3-year All Upfront basis for supported instance families (verify exact rates at aws.amazon, rates change frequently). Moving from 1-year No Upfront to 3-year Partial Upfront where usage is stable can add 15-25 percentage points to your effective discount rate on those resources, directly translating to higher ESR.
If your recommendations refresh slowly: invest in faster data loops
AWS Cost Explorer refreshes commitment recommendations every 72+ hours. A usage pattern shift within that window, a major deployment, a service deprecation, an autoscaling event, produces a coverage gap that is invisible to the recommendation engine until the next refresh. For organizations with dynamic workloads, this lag represents a measurable, recurring ESR drag. More frequent refreshes mean coverage adjustments happen closer to when usage actually changes, which keeps both coverage and utilization higher and ESR more stable over time.
How to measure ESR improvement over time
ESR is a lagging indicator. Changes you make to your commitment portfolio today show up in ESR results at the next billing cycle. Build a monthly ESR tracking cadence, not a daily one. Daily ESR fluctuates with billing timing and cannot be benchmarked reliably.
Track ESR at three levels simultaneously. First, total ESR across all eligible compute spend. This is the headline number you report to finance and leadership. Second, ESR by service group: EC2 and Fargate separate from RDS and database services, because the discount mechanisms differ and a problem in one group can mask improvement in another. Third, ESR by account or business unit in a multi-account AWS Organization. An average ESR of 28% across 10 accounts can hide one account at negative 5% pulling down nine accounts averaging 32%.
Set a monthly ESR review ritual. Pull the prior month’s CUR data. Calculate ESR at all three levels. Compare to the prior month and the same month a year ago. Flag any account or service group where ESR dropped more than 5 percentage points month over month. Investigate that drop before it compounds into a multi-month waste trend.
ESR target-setting by spend tier
Setting an ESR target without context is not useful. A startup spending $200K per year on compute cannot reasonably target 40% ESR because the volume of commitments required to reach that rate does not match the usage volume. Use the benchmark data as your reference.
For organizations under $1M in annual compute spend, a 20-25% ESR is a strong target. For organizations spending $1M to $5M annually, 30-35% is achievable with active commitment management. For organizations above $5M, 40% or higher is realistic with automation. The 46% world-class figure requires sophisticated commitment portfolio management that most manual processes cannot sustain.
One practical rule of thumb: if your current ESR is more than 15 percentage points below the 75th percentile for your spend tier, that gap represents a quantifiable annual savings opportunity. At $5M ODE spend with a 10% ESR versus a 25% benchmark, the gap is $750K per year. That number is worth presenting to leadership as the cost of inaction on commitment optimization.
Usage.ai customers across 300+ enterprises have made exactly this improvement. Motive reduced annual cloud spend by $5.2M. EVGo (NASDAQ: EVGO) saved $2.3M annually. Secureframe saved $480K and reinvested it directly into product growth.
The path from 0% ESR to above the 75th percentile benchmark is not a multi-year project. It is a commitment coverage and portfolio management problem that Usage.ai addresses in 30 minutes of setup, billing-layer access only, no infrastructure changes required.
What ESR Cannot Measure
ESR is the right metric for measuring cloud commitment ROI. That is precisely why it is worth being explicit about what it does not measure. These are not criticisms of ESR as a metric. They are gaps that matter to any FinOps team running commitments in a dynamic environment.
ESR cannot measure commitment risk
ESR shows your savings performance. It does not show whether those savings are protected if your usage drops. A team can run 40% ESR for three quarters, then have a major product line deprecated and watch their ESR collapse to negative territory overnight. ESR recorded what happened. It had no way to prevent or mitigate it.
The -9% minimum observed ESR benchmarking data was not a data error. It was the result of real organizations that committed aggressively and then saw usage fall. At that point, the commitment cost exceeded the discount benefit. ESR went negative. The organization paid more than if they had never purchased a commitment at all.
ESR cannot distinguish between cashback and credits
When commitments are underutilized, some platforms offer compensation. The type of compensation is not visible in ESR. A platform that pays real-money cashback on underutilized commitments, spendable anywhere, produces a fundamentally different financial outcome than a platform that pays vendor-locked credits redeemable only against future spend on the same cloud. ESR treats both identically because it measures what you saved, not what you recovered or how flexible that recovery is.
ESR cannot measure exit cost exposure
ESR measures the ongoing savings rate while a tool is running. It does not measure the financial obligations that may be triggered by stopping the tool. Some commitment management platforms include contractual terms that trigger fee obligations on unrealized future savings if a customer exits before commitment terms expire. That obligation is completely invisible in ESR.
What is the difference between ESR 1.0 and ESR 2.0?
ESR 1.0, the original metric introduced by ProsperOps in 2019 and adopted by the FinOps Foundation, measures cloud commitment ROI on compute resources: EC2, Fargate, Lambda, RDS, ElastiCache, Redshift, and OpenSearch. It answers the rate optimization question for commitment-eligible services and nothing else.
ESR 2.0 is an expansion of the metric concept that ProsperOps has indicated is in development. It is intended to extend ESR beyond compute commitments to broader cloud cost categories. As of Q1 2025, ESR 2.0 is not a FinOps Foundation-ratified standard. The FinOps Foundation’s published ESR playbook covers the ESR 1.0 definition. Verify the current state of ESR 2.0 at finops.org and prosperops.com before citing it in any internal or external reporting.
For most FinOps teams today, ESR 1.0 is the operative metric. If you are benchmarking against ProsperOps’ 2024 data (0% median, 23% at 75th percentile, 46% at 98th percentile), you are benchmarking against ESR 1.0. ESR 2.0 does not yet have equivalent published benchmark data.
What comes after ESR: Insured Commitment Rate (ICR)
Insured Commitment Rate (ICR) is a new cloud FinOps metric introduced by Usage.ai that extends ESR by adding cashback recovery on underutilized commitments to the numerator. It measures the risk-adjusted, downside-protected savings rate you can count on, not just the rate you achieve under ideal conditions.
ICR = (Cloud Savings + Cashback Recovered) / ODE Spend
ICR is always greater than or equal to ESR because cashback is additive, never subtractive. When every commitment is fully utilized, ICR equals ESR. When utilization drops and cashback kicks in, ICR exceeds ESR by exactly the value of the cashback received.
ESR can go negative. ICR cannot, because every underutilized commitment is offset by real-money cashback rather than absorbed as a loss.
For the full comparison, including worked examples, read: ESR vs ICR: The Savings Metric That Does Not Go Negative.
Conclusion
ESR is the metric that replaced a decade of wishful thinking about cloud savings. Coverage numbers that looked great while bills kept climbing. Utilization reports that nobody knew how to act on. ESR ended that by asking the only question that matters: what percentage of your cloud spend are you actually saving?
The answer, for half of all AWS organizations, is zero.
If you are above zero, the benchmarks in this guide tell you exactly where you stand and how far you are from world-class. If you are at zero, the six root causes tell you exactly why and where to start.
One thing ESR cannot tell you is whether your savings are protected when something goes wrong. Usage drops. Services get deprecated. A team restructures overnight. ESR will record what happened with perfect accuracy. What it will not show is whether anything existed to recover the loss.
That is the question the next metric answers. Start with ESR. Know your number. Then ask whether the savings you have built are as durable as they look on paper.
Frequently Asked Questions
1. What is Effective Savings Rate (ESR)?
Effective Savings Rate (ESR) is a FinOps KPI that measures the true ROI of cloud discount instruments as a percentage. It answers what percentage off the on-demand rate are you actually achieving across all eligible cloud resources. The formula is: ESR = 1 minus (Actual Spend with Discounts / On-Demand Equivalent Spend). A 30% ESR means you are paying 30% less than full on-demand pricing across your entire eligible compute footprint.
2. How do you calculate Effective Savings Rate?
ESR = 1 minus (Actual Spend Including Discounts / On-Demand Equivalent Spend). In AWS, pull actual spend from lineItem/NetAmortizedCost in the Cost and Usage Report. Pull ODE spend from pricing/publicOnDemandCost for the same period and services. Divide actual by ODE, subtract from 1, and express as a percentage. Calculate over a full calendar month for accurate benchmarking. Filter to commitment-eligible services only.
3. What is a good Effective Savings Rate?
Based on ProsperOps’ benchmarking data, the industry median ESR rose from 0% in 2023 to 15% in 2024 as more organizations adopted commitments. The 75th percentile is 23% and world-class at the 98th percentile is 46%. For organizations spending over $5M per year, the 75th percentile rises to 40%. An ESR of 30% or above is strong for most enterprises. Verify current benchmarks at prosperops.com/library, as reports are updated annually.
4. Why is my ESR low?
Low ESR despite high coverage typically means low utilization, a low discount rate, or coverage concentrated on the wrong resources. You can have 90% RI coverage and still have poor ESR if 30% of your commitments are stranded (utilization issue), or if you bought 1-year No Upfront commitments when 3-year Partial Upfront would deliver 20+ percentage points higher discount. ESR surfaces the net outcome of all three factors simultaneously.
5. Can ESR be negative?
Yes. ESR goes negative when underutilized commitments cost more than the discount benefit they deliver. ProsperOps’ 2024 benchmarking data recorded a minimum ESR of negative 9% across real enterprise AWS accounts. This happens when usage drops significantly and commitments continue charging with minimal coverage benefit. At that point, running fully on-demand would have been cheaper than the commitment portfolio that was purchased.
6. How is ESR different from coverage and utilization?
Coverage measures what percentage of resources have a discount applied. Utilization measures what percentage of purchased commitments are consumed. ESR measures the actual ROI, i.e., the net savings rate across total eligible spend. Coverage and utilization are input metrics. ESR is the output metric. You can have high coverage and high utilization and still have poor ESR if your discount rates are low or your coverage targets the wrong resource types.
7. Does ESR work for Azure and GCP, not just AWS?
Yes. The formula is identical across all three major clouds. For Azure: use CostInBillingCurrency versus PayGPrice multiplied by Quantity from the Azure Cost Management usage detail export. For GCP: use the cost field versus on_demand_cost from Cloud Billing BigQuery export. GCP has no native ESR view as of Q1 2025 and requires a custom BigQuery calculation. Verify current field names in official documentation before building any calculation pipeline.
8. What does ESR not measure?
ESR does not measure commitment risk. It shows your savings rate but not whether those savings are protected if usage drops. It cannot distinguish between platforms that pay real-money cashback on underutilized commitments versus those that pay vendor-locked credits. It also does not surface exit cost exposure from contractual terms. For teams managing dynamic workloads, Insured Commitment Rate (ICR), introduced by Usage.ai, extends ESR by adding cashback recovery to account for downside protection.
9. What is the difference between ESR 1.0 and ESR 2.0?
ESR 1.0 is the original metric introduced by ProsperOps in 2019 and ratified by the FinOps Foundation. It measures ROI on commitment-eligible compute resources: EC2, Fargate, Lambda, RDS, and equivalent services. ESR 2.0 was presented by ProsperOps at FinOps X 2025 and is intended to extend ESR beyond compute commitments to broader cloud cost categories. As of Q1 2025, ESR 2.0 is not a FinOps Foundation-ratified standard. All published industry benchmarks refer to ESR 1.0.
10. How do I improve my Effective Savings Rate?
Start with coverage. Sort your CUR data by on-demand equivalent spend descending and apply commitments to the top 20% of resources, which typically represent 60-70% of your total ODE. If utilization is below 80%, reduce commitments before adding more. If your discount rate is below 25%, move from 1-year No Upfront to 3-year Partial Upfront on stable workloads. If recommendations refresh slowly, invest in faster data loops. Each dimension, coverage, utilization, and discount rate, compounds when optimized together.