.png)



AI infrastructure cost allocation
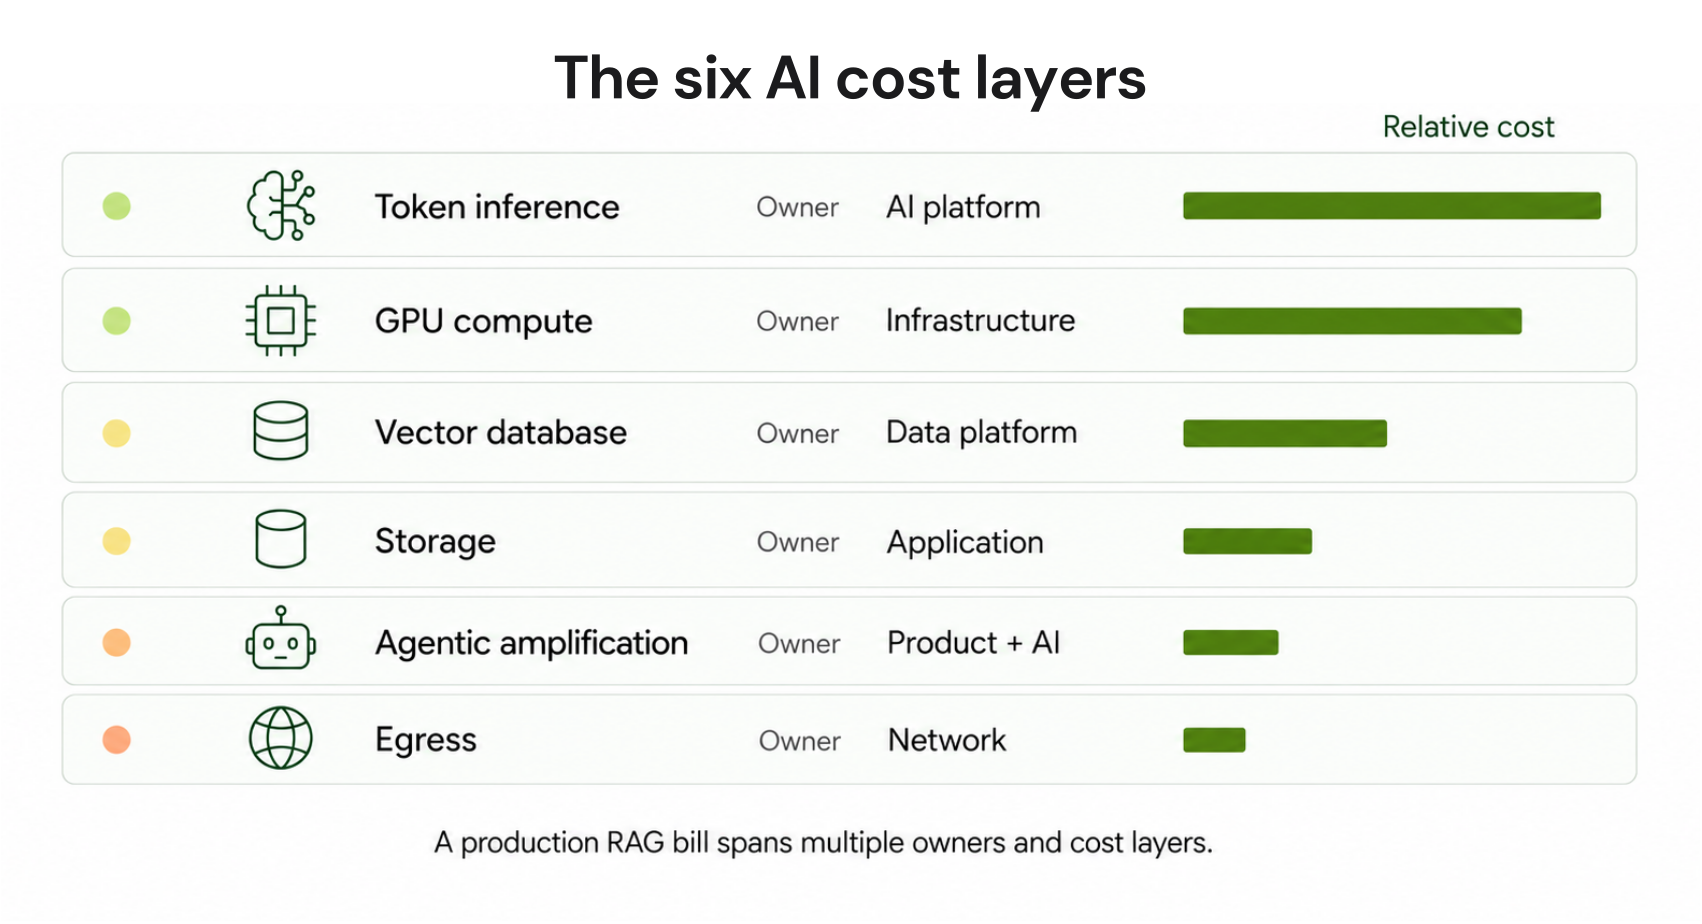
AI infrastructure cost allocation means attributing the different layers of an AI bill to the team, product, application, or workload that generated the spend.A production AI workload rarely has one cost line. Depending on the architecture, the bill can include model inference, GPU compute, vector databases, storage, agentic workflows, and data transfer.
On Amazon Bedrock, AWS provides several native attribution mechanisms. The appropriate method depends on the Bedrock endpoint, API, and the level of attribution you need. Shared GPU, storage, and network costs still require workload metadata and documented allocation rules.
Cloud pricing changes frequently. Any prices or examples in this guide are illustrative unless explicitly identified as a current rate. Always verify the applicable AWS pricing page before using a figure for budgeting, forecasting, or procurement.
Short answer
AI infrastructure cost allocation attributes the six common layers of an AI bill token inference, GPU compute, vector databases, storage, agentic workloads, and egress to the team, product, or workload that generated them.For Amazon Bedrock, teams can use IAM principal attribution for identity-level billing, application inference profiles for application or workload attribution on supported bedrock-runtime APIs, and Projects for supported workloads on the bedrock-mantle endpoint. Per-request metadata can add prompt-level attribution in model invocation logs.
Most teams should start with showback, establish reliable allocation rules, and then move to chargeback once the data is trusted and teams can act on it.
Layer 1: Token inference costs
Token inference is highly visible, but pricing varies by model, service tier, inference profile, Region, and routing configuration. Always check the applicable Amazon Bedrock pricing page before budgeting.Output-heavy workloads, prompt caching, and batch inference can also change effective costs.
Owner: Product or application team.
Attribution options:
- Separate IAM identities: Attribute billed dollars by team or user.
- Shared application role: Use inference profiles or Projects where supported.
- Per-prompt detail: Use request metadata and model invocation logs.
- Shared gateway: Combine IAM/session design with request metadata.
For model routing and selection, see our LLM cost optimization on AWS guide
Layer 2: GPU compute
For teams running their own training, fine-tuning, or self-hosted inference, GPU compute can become the dominant infrastructure cost.The allocation challenge is usually more important than the list price. A shared GPU cluster may support several teams, workloads, environments, or experiments simultaneously. Charging the entire instance to one owner can therefore distort the economics of every workload running on it.
Pricing check: GPU on-demand, Reserved Instance, and Spot prices vary by instance family, Region, purchasing option, and AWS pricing changes. Verify current rates directly on the Amazon EC2 pricing pages before budgeting.
For shared environments, allocate cost using measurable consumption:
- SageMaker training or inference workload tags where supported.
- EKS split cost allocation data for Kubernetes workloads.
- GPU-hours, accelerator utilization, or another documented usage metric.
- A defined treatment for idle capacity and platform overhead.
Owner: the ML platform or infrastructure team.
long GPU commitments. GPU generations can change faster than commitment terms. Before committing to a long purchasing term, compare expected workload duration, hardware roadmap, utilization, and the consequences of stranded capacity.
Layer 3: vector databases and retrieval
RAG introduces infrastructure costs that token calculators do not capture. The main components include:- Retrieval infrastructure.
- Vector storage.
- Search and indexing compute.
- Additional input tokens created by retrieved context.
- Workload-specific retrieval costs.
- Shared indexes.
- Shared search infrastructure.
- Storage.
- Platform overhead.
Layer 4: storage that compounds
Training datasets, checkpoints, embeddings, model artifacts, and logs accumulate over time. Storage costs can therefore become an allocation problem even when the model inference bill looks reasonable. Common cost sources include:- Amazon S3 datasets and model artifacts.
- EBS volumes used for training or inference.
- CloudWatch and other logging services.
- Backup and retention storage.
- Intermediate files and checkpoints.
Layer 5: agentic workloads
Agentic systems can make AI infrastructure allocation substantially harder because one user request may generate many underlying operations. A single request can trigger:- An initial model call.
- Several tool calls.
- Additional model reasoning.
- Retrieval operations.
- A synthesis call.
- Retries or corrective calls.
- Model calls per user request.
- Input and output tokens per step.
- Tool calls.
- Retrieval operations.
- Retry frequency.
- Context growth.
- Cost per completed outcome.
Layer 6: egress and data transfer
AI workloads can generate data-transfer charges when traffic moves:- Across AWS Regions.
- Across Availability Zones.
- Between AWS services.
- From AWS to the public internet.
- Through NAT gateways or other network infrastructure.
Who owns each cost layer
| Layer | Owner | How to attribute |
|---|---|---|
| Token inference | Product or app team | IAM principal attribution, tagged inference profiles, Projects, or request metadata |
| GPU compute | ML platform or infrastructure | SageMaker workload tags or EKS split cost allocation |
| Vector database | RAG app owner | Workload metadata and per-team indexes |
| Storage | Workload owner | Resource tags, bucket ownership, and usage-based allocation |
| Agentic workloads | Agent-deploying team | IAM session attribution plus application tracing |
| Egress | Infrastructure or platform | Network telemetry, NAT gateway data, and resource metadata |
- Shared GPU clusters.
- Idle GPU capacity.
- Platform overhead.
- Shared vector infrastructure.
- NAT gateways.
- Common storage.
- Other centrally managed services.
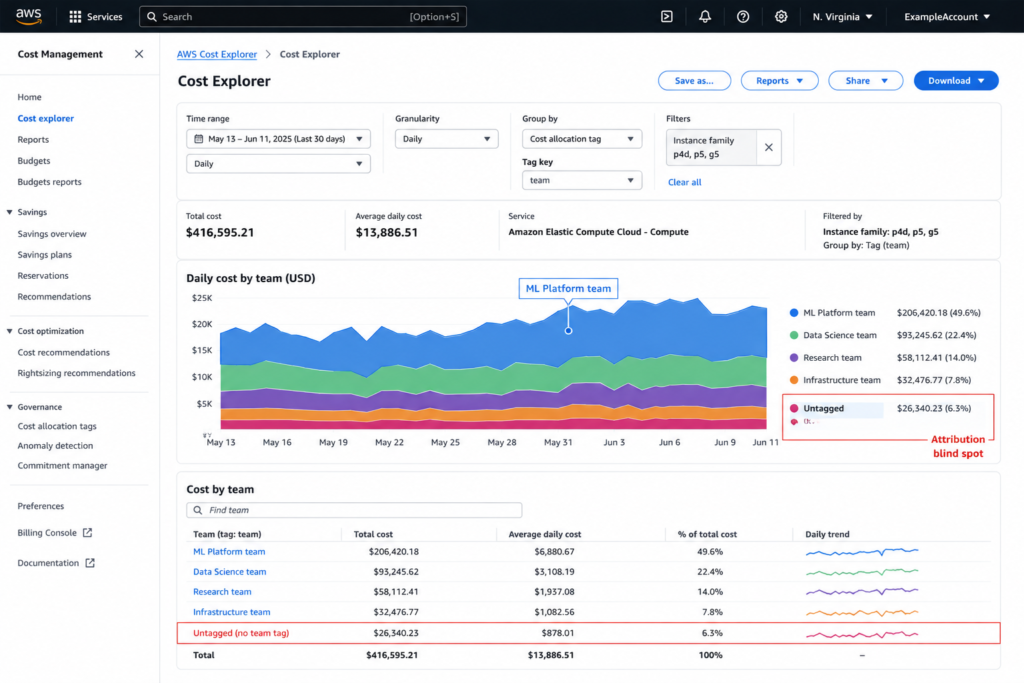
Where to start: a readiness matrix
| Current state | Recommended first action |
|---|---|
| No attribution yet | Configure CUR 2.0 to include caller identity, activate relevant IAM principal tags, and establish workload-level tagging for the highest-spend teams |
| Some tags, no shared-cost rule | Define a utilization-based split for shared GPU and platform costs; publish as showback |
| Full tagging, showback running | Add IAM session attribution where appropriate and improve application-level tracing |
| Showback mature | Move to chargeback by cost center and establish per-team, per-layer budget alerts |
What a full AI stack costs, and how to attribute it
Illustrative example assumptions only, not a customer result. Consider a support assistant with:- 50,000 monthly queries.
- 3,000 input tokens of retrieved context per query.
- 500 output tokens per query.
- A Bedrock-hosted model.
- A retrieval layer.
- CloudWatch logging.
- Input inference: monthly input tokens × current Bedrock input-token rate.
- Output inference: monthly output tokens × current Bedrock output-token rate.
- Retrieval: current compute and storage consumption for the selected retrieval service.
- Storage: actual GB-month consumption by storage class.
- Logging: actual ingestion and retention volume.
- Shared infrastructure: documented allocation percentage.
| Team | Workload | Env | Direct | Shared | Total | Cost per outcome |
|---|---|---|---|---|---|---|
| Support | RAG assistant | prod | $460 | $90 | $550 | $0.011 / ticket |
| Platform | Code-review agent | prod | $700 | $110 | $810 | $0.42 / review |
| Data | Batch classification | prod | $300 | $40 | $340 | $0.003 / doc |
AI infrastructure cost allocation checklist
- Identify every major AI infrastructure cost layer, not just token inference.
- Use the right AWS attribution method IAM principal attribution, application inference profiles, Projects, and per-request metadata based on the workload.
- Standardize cost allocation tags and reporting, including allowing for AWS reporting lag.
- Allocate shared GPU infrastructure correctly using SageMaker workload tags or EKS split cost allocation, remembering EKS split data is not available in Cost Explorer.
- Establish governance for unallocated and shared costs, define split rules, maintain an unallocated bucket, run showback before chargeback, and track cost per outcome alongside cost per request.
How Usage.ai Helps Teams Optimize AI Infrastructure Costs
Cost allocation shows which teams and workloads are driving AI infrastructure spend. The next step is reducing the cost of that consumption. Engineering teams can reduce consumption through architecture decisions, rightsizing, resource efficiency, and operational optimization. Once a stable usage baseline is established, Usage.ai focuses on the pricing and commitment layer. We analyze cloud usage, evaluate commitment opportunities, execute approved commitment-management actions, and continuously optimize coverage as usage changes. This helps teams improve the rates they pay for predictable cloud consumption while maintaining flexibility as their AI workloads evolve. Through our Flex Insured Commitment Program, teams can achieve up to 50% savings on covered cloud spend, on average, while reducing the financial risk of long-term cloud commitments. Our pricing model is based on a percentage of realized savings, with eligible commitments including cashback protection for underutilization. The cloud provider continues to supply the underlying commitment products, pricing, eligibility rules, and billing mechanics. Usage.ai adds the optimization, execution, and protection layer around eligible commitments, helping teams turn stable cloud usage into savings with less operational overhead and commitment risk.Can ICR go negative?
Yes. This is an important mathematical distinction.When should you track ESR or ICR?
ESR is the better choice when you want to:- Benchmark commitment performance
- Compare savings performance over time
- Evaluate realized savings rather than advertised discounts
- Communicate a recognized FinOps rate-optimization KPI
- Compare commitment strategies using a consistent ODE methodology
- A commitment program provides a defined recovery mechanism
- The recovery amount can be measured and reconciled
- The recovery belongs to the same commitment portfolio and reporting period
- Finance wants to see the effect of recovered value alongside commitment savings
Worked example: ESR vs ICR
Consider an illustrative measurement period:- ODE spend: $820,000
- Cloud savings generated: $140,000
- Eligible cashback actually recovered: $42,000
ICR is therefore approximately 5.1 percentage points higher than ESR.
The $42,000 recovery is not additional cloud-provider discount savings. It is the recovered value included in the ICR numerator under this methodology.
Note:
The example is illustrative only. A particular usage decline does not imply a particular cashback amount. Actual recovery depends on the applicable commitment structure, eligibility, timing, and protection terms.
How to compare ESR and ICR correctly
The biggest reporting mistake is comparing two percentages that were calculated using different accounting rules. Before comparing ESR and ICR, confirm:- Same scope: Use the same accounts, services, workloads, and commitment portfolio.
- Same period: A monthly ICR should not be compared with an annual ESR.
- Same ODE methodology: The on-demand-equivalent baseline must be calculated consistently.
- Same savings treatment: Define whether Cloud Savings Generated is gross commitment savings or incorporates costs required to achieve those savings.
- Same recovery treatment: Count only eligible recovery that can be attributed to the measured portfolio and period.
- Clear treatment of fees and credits: If platform or management fees affect the economic result, state whether they are included in the savings numerator. Treat cloud credits separately unless the methodology explicitly defines them as eligible recovery.
How Usage.ai fits into Insured Commitment Rate
.Our Flex Commitments are designed to deliver the savings benefits of cloud commitments with greater flexibility and protection against eligible underutilization. We analyze cloud usage, recommend commitment levels, automate approved purchases, and manage Flex Commitments as part of the program. See What is the Flex-Commit Program?. With Flex Commitments, teams can access up to 57% savings associated with a 3-year AWS commitment without taking on the long-term commitment risk. If a commitment becomes more expensive than the equivalent On-Demand usage, Usage.ai provides cashback protection to help cover the difference. Our Flex-Commit Program uses performance-based pricing, with customers paying a percentage of realized savings. For ICR, the relevant amount is the value actually recovered through cashback during the measurement period. ICR incorporates that recovered value alongside realized commitment savings, providing a broader measure of risk-protected savings. ICR is a measurement framework, not a guarantee of a particular savings rate or recovery amount.A practical commitment-reporting framework
ESR and ICR should not be expected to answer every commitment question. A practical reporting stack can include:- ESR: realized commitment savings
- Coverage: how much eligible usage is covered
- Utilization: how much purchased commitment is consumed
- Lock-in metric: time-related commitment exposure, where applicable
- ICR: savings plus eligible recovered cashback when a qualifying recovery mechanism exists
Common ESR and ICR mistakes
- Confusing nominal discount with realized savings: A 50% commitment discount does not automatically produce a 50% ESR.
- Calling ICR an industry standard: ICR is Usage.ai-defined. It should not be presented as a FinOps Foundation metric.
- Assuming ICR cannot be negative: It can. Recovery must be large enough to offset a negative savings numerator before ICR reaches zero.
- Counting promised recovery: Only eligible recovery actually recognized under the defined methodology should be included.
- Mixing denominators: ESR and ICR must use consistent ODE methodology, scope, and measurement period.
- Treating every recovery as cash: Cashback and cloud credits are not interchangeable. Report them according to the applicable terms and accounting policy.
Once your AI cost layers are attributed, Usage.ai turns the stable baseline into savings with Flex Commitments and cashback protection.
Frequently asked questions
How does Amazon Bedrock attribute inference cost to teams?
Bedrock supports IAM principal attribution, application inference profiles, Projects, and per-request metadata. The right option depends on the endpoint and required attribution level.
Why is my AI bill higher than forecast?
Token costs are only one layer. Context tokens, retrieval, logging, GPUs, data transfer, idle resources, and agent workflows can increase spend. Compare costs across all infrastructure layers.
How do I allocate GPU costs in SageMaker or EKS?
Use workload and resource tags for SageMaker. In EKS, AWS split cost allocation can distribute shared compute costs by Kubernetes workload based on resource consumption.
What are IAM STS session tags?
STS session tags are attributes attached to assumed-role sessions that can help associate AWS activity and Bedrock costs with teams or cost centers. They differ from application-level agent-session tags and correlation IDs.
Does cross-Region inference cost extra on Bedrock?
There is no universal cross-Region surcharge. Pricing depends on the inference profile, model, source Region, and routing configuration. Check current Bedrock pricing before forecasting.
How much can reserved pricing cut AI GPU costs?
There is no fixed discount. Savings depend on instance type, Region, purchase option, term, and utilization. Compare on-demand rates with applicable commitments before purchasing.